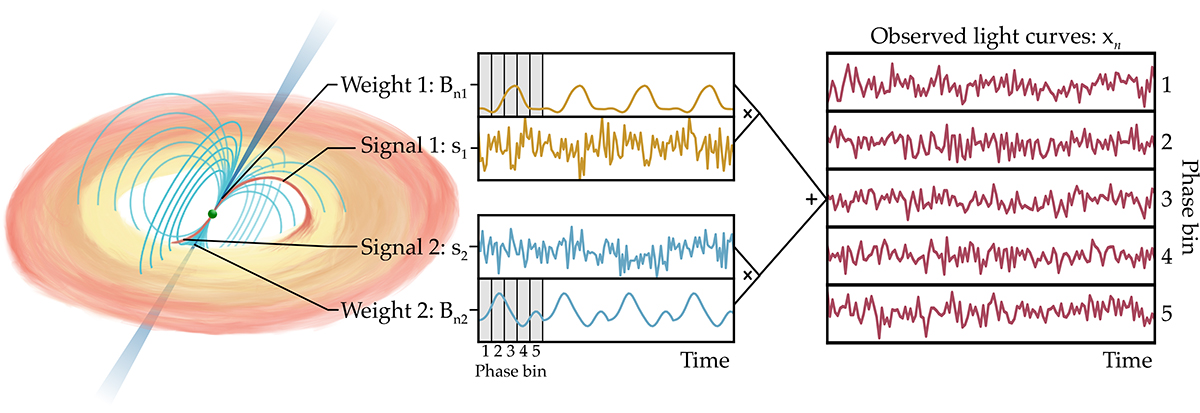
Fig. 1.
Download original image
Sketch of an accreting X-ray pulsar and the components that make up its observed light curve as a function of phase. At the distance of the inner accretion disk, the magnetic dipole field dominates and matter flows along the magnetic field lines onto the magnetic poles of the neutron star where it releases X-rays. We consider the accretion rates onto each of the poles to be our signals (s1 and s2) since fluctuations of the accretion rate are roughly translated into fluctuations of the observed X-ray flux; and the beam intensity at a given pulse phase is the single-pole pulse profile, also called the weights (Bn1 and Bn2 for n phase bins). In the figure, the single-pole pulse profiles are shown in the grey box along with five phase bins as an example. The profiles were then repeated for the rest of the observation for clarity. These weights cause the X-ray flux at a given pulse phase to be systematically offset and the flux in two different phase bins appears correlated if the radiation at that phase originates from the same pole, but less correlated if both poles contribute. The observed phase-resolved light curves (xn) are then the result of a mix of the emission from both poles.
Current usage metrics show cumulative count of Article Views (full-text article views including HTML views, PDF and ePub downloads, according to the available data) and Abstracts Views on Vision4Press platform.
Data correspond to usage on the plateform after 2015. The current usage metrics is available 48-96 hours after online publication and is updated daily on week days.
Initial download of the metrics may take a while.