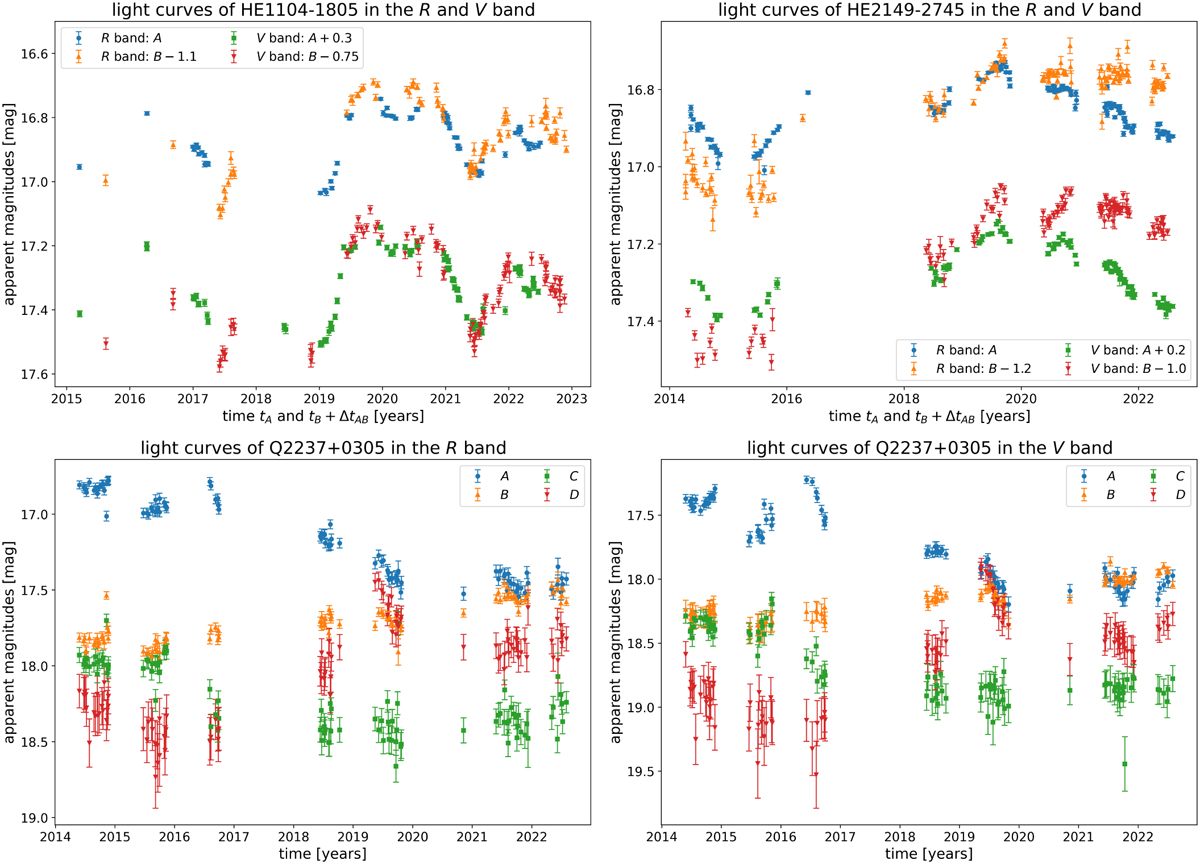
Fig. 6
Download original image
Final light curves. Upper row: time delay corrected light curves of the images of HE1104-1805 and HE2149-2745 in the R and V bands together respectively, including offsets of the apparent magnitudes for the individual images for displaying reasons. Lower row: light curves of the four images of Q2237+0305 separated into R and V bands with no time delays or magnitude offsets included.
Current usage metrics show cumulative count of Article Views (full-text article views including HTML views, PDF and ePub downloads, according to the available data) and Abstracts Views on Vision4Press platform.
Data correspond to usage on the plateform after 2015. The current usage metrics is available 48-96 hours after online publication and is updated daily on week days.
Initial download of the metrics may take a while.