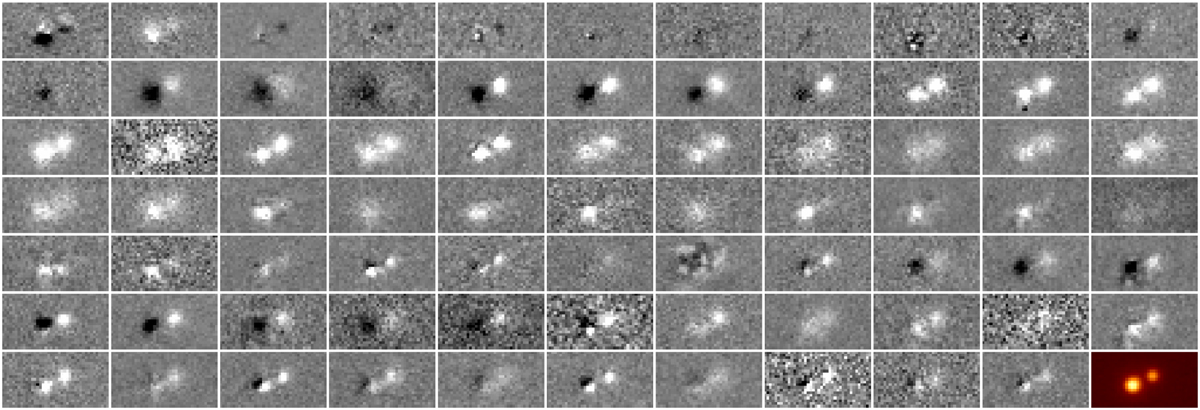
Fig. 5
Download original image
Difference images of HE1104-1805 in the R band from mid 2014 in the upper left to mid 2022 in the lower right (second last image). Shown is the flux in each pixel relative to reference image linearly in grey scale (where white means brighter and black darker), while the last image in the lower right shows the flux in the corresponding reference image logarithmically coloured.
Current usage metrics show cumulative count of Article Views (full-text article views including HTML views, PDF and ePub downloads, according to the available data) and Abstracts Views on Vision4Press platform.
Data correspond to usage on the plateform after 2015. The current usage metrics is available 48-96 hours after online publication and is updated daily on week days.
Initial download of the metrics may take a while.