Fig. 4
Download original image
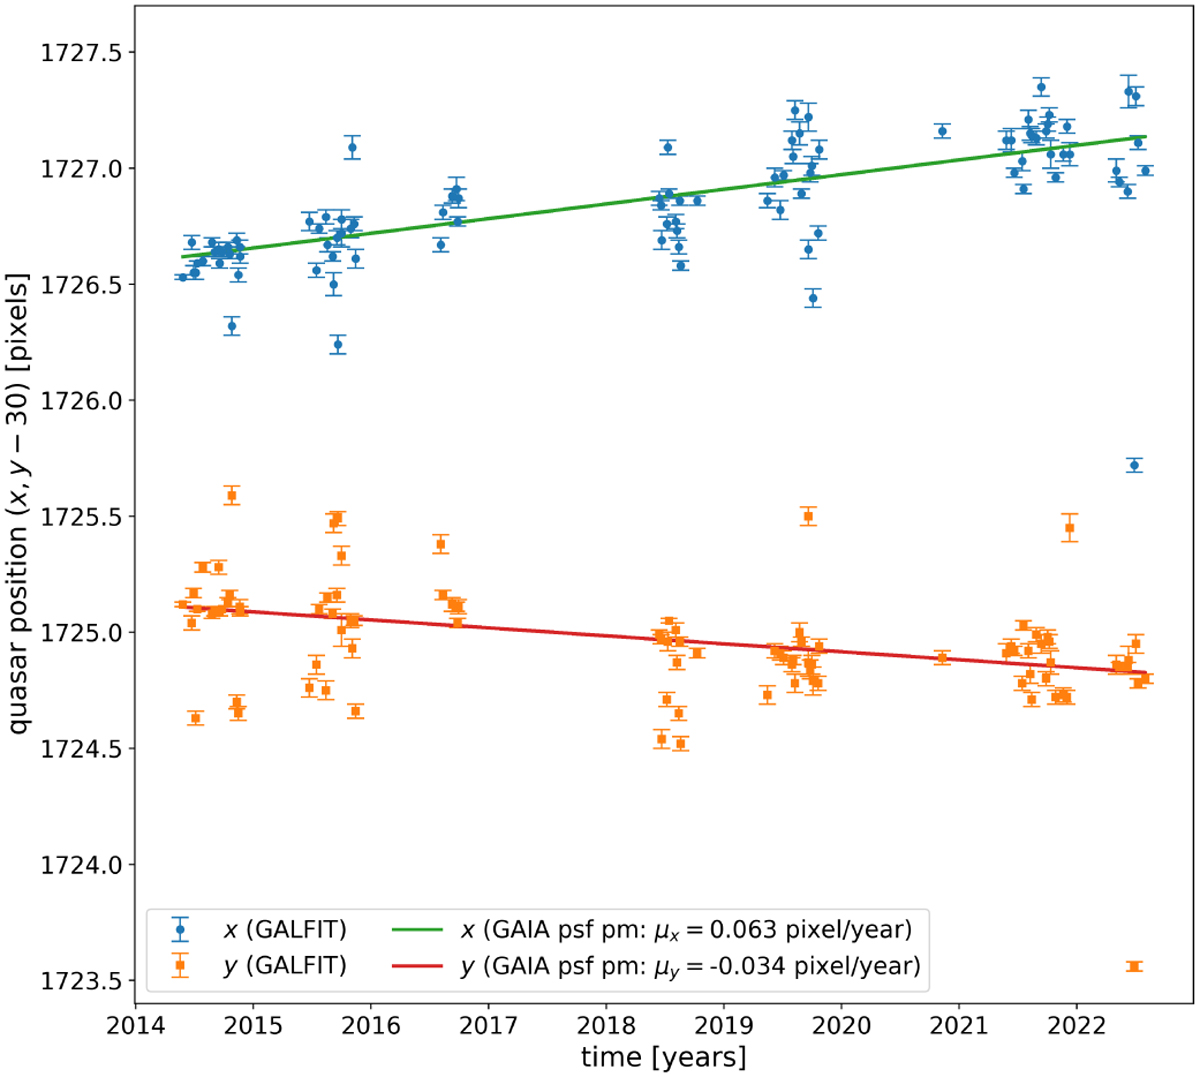
Q2237+0305 image A x and y pixel positions rQSO(t) as a function of time (in the R band) determined by GALFIT on the combined images shown as upper (blue) and lower (orange) data points respectively. The lines are no fits to these positions, but simply lines ![]() with the proper motion µPSF of the PSF star from Gaia as slope and the median of all proper motion corrected positions as overall offset
with the proper motion µPSF of the PSF star from Gaia as slope and the median of all proper motion corrected positions as overall offset ![]() (see Eq. (6)). We did this for all six datasets and then used the lines as fixed quasar image A positions when applying GALFIT to the difference images to determine the light curves.
(see Eq. (6)). We did this for all six datasets and then used the lines as fixed quasar image A positions when applying GALFIT to the difference images to determine the light curves.
Current usage metrics show cumulative count of Article Views (full-text article views including HTML views, PDF and ePub downloads, according to the available data) and Abstracts Views on Vision4Press platform.
Data correspond to usage on the plateform after 2015. The current usage metrics is available 48-96 hours after online publication and is updated daily on week days.
Initial download of the metrics may take a while.