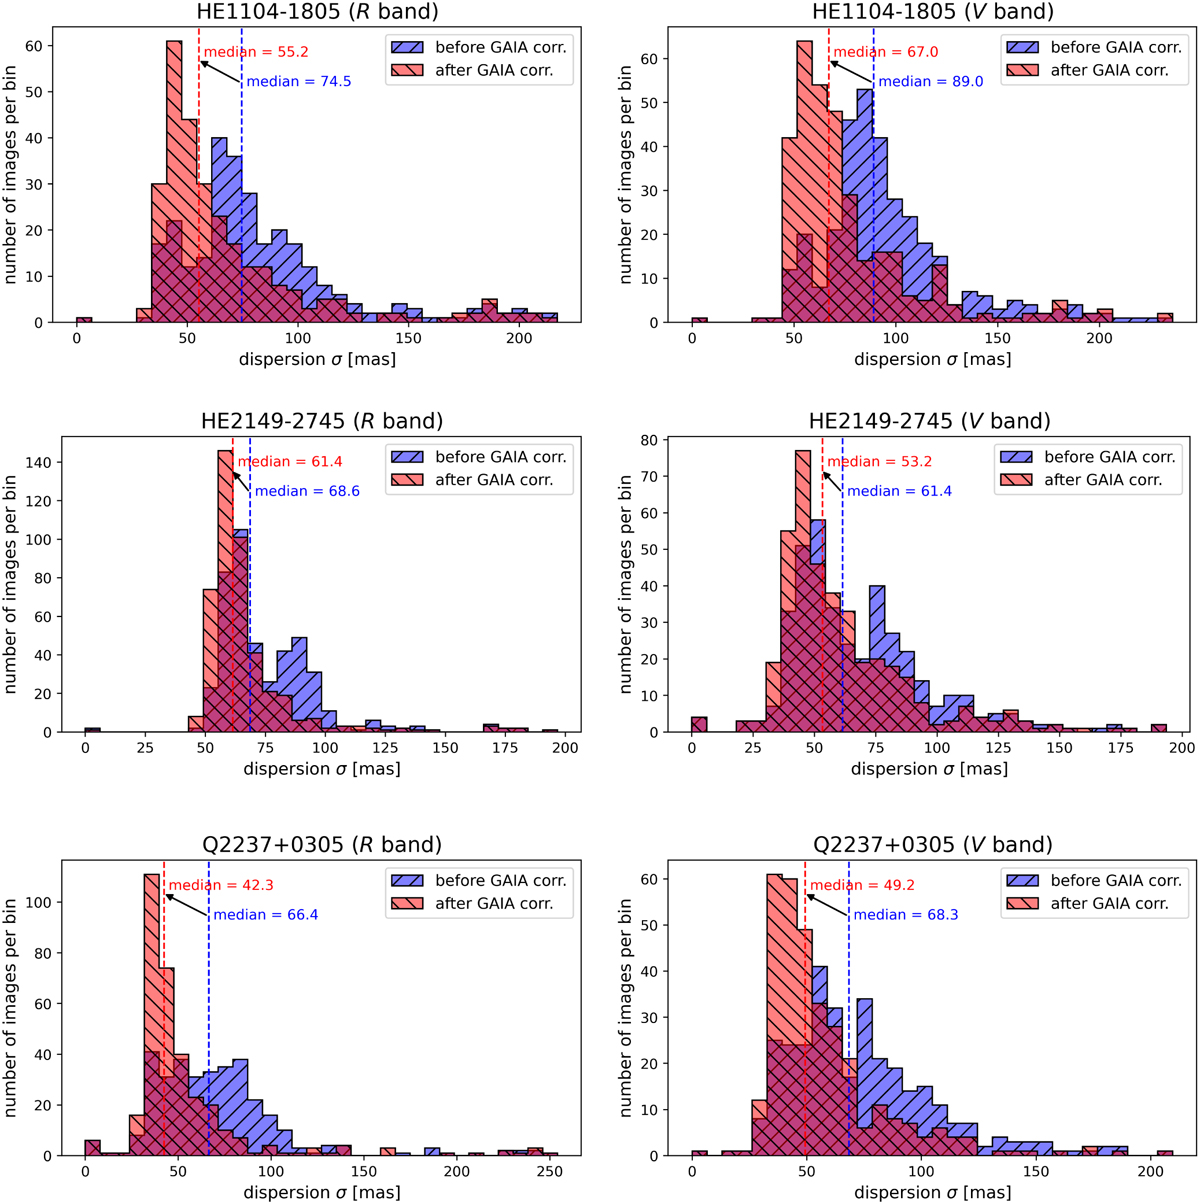
Fig. 2
Download original image
Results of aligning all the images of HE1104-1805 (first row), HE2149-2745 (second row) and Q2237+0305 (third row) in the R (left column) and V (right column) band. We show the dispersion σ (see Eq. (2)) i.e. the standard deviation of all star position distances in mas between an aligned image and the reference image for all aligned images without (blue) and with (red) our new method using Gaia proper motion data. The improvement of the median dispersion over all images is shown as well.
Current usage metrics show cumulative count of Article Views (full-text article views including HTML views, PDF and ePub downloads, according to the available data) and Abstracts Views on Vision4Press platform.
Data correspond to usage on the plateform after 2015. The current usage metrics is available 48-96 hours after online publication and is updated daily on week days.
Initial download of the metrics may take a while.