Fig. A.1.
Download original image
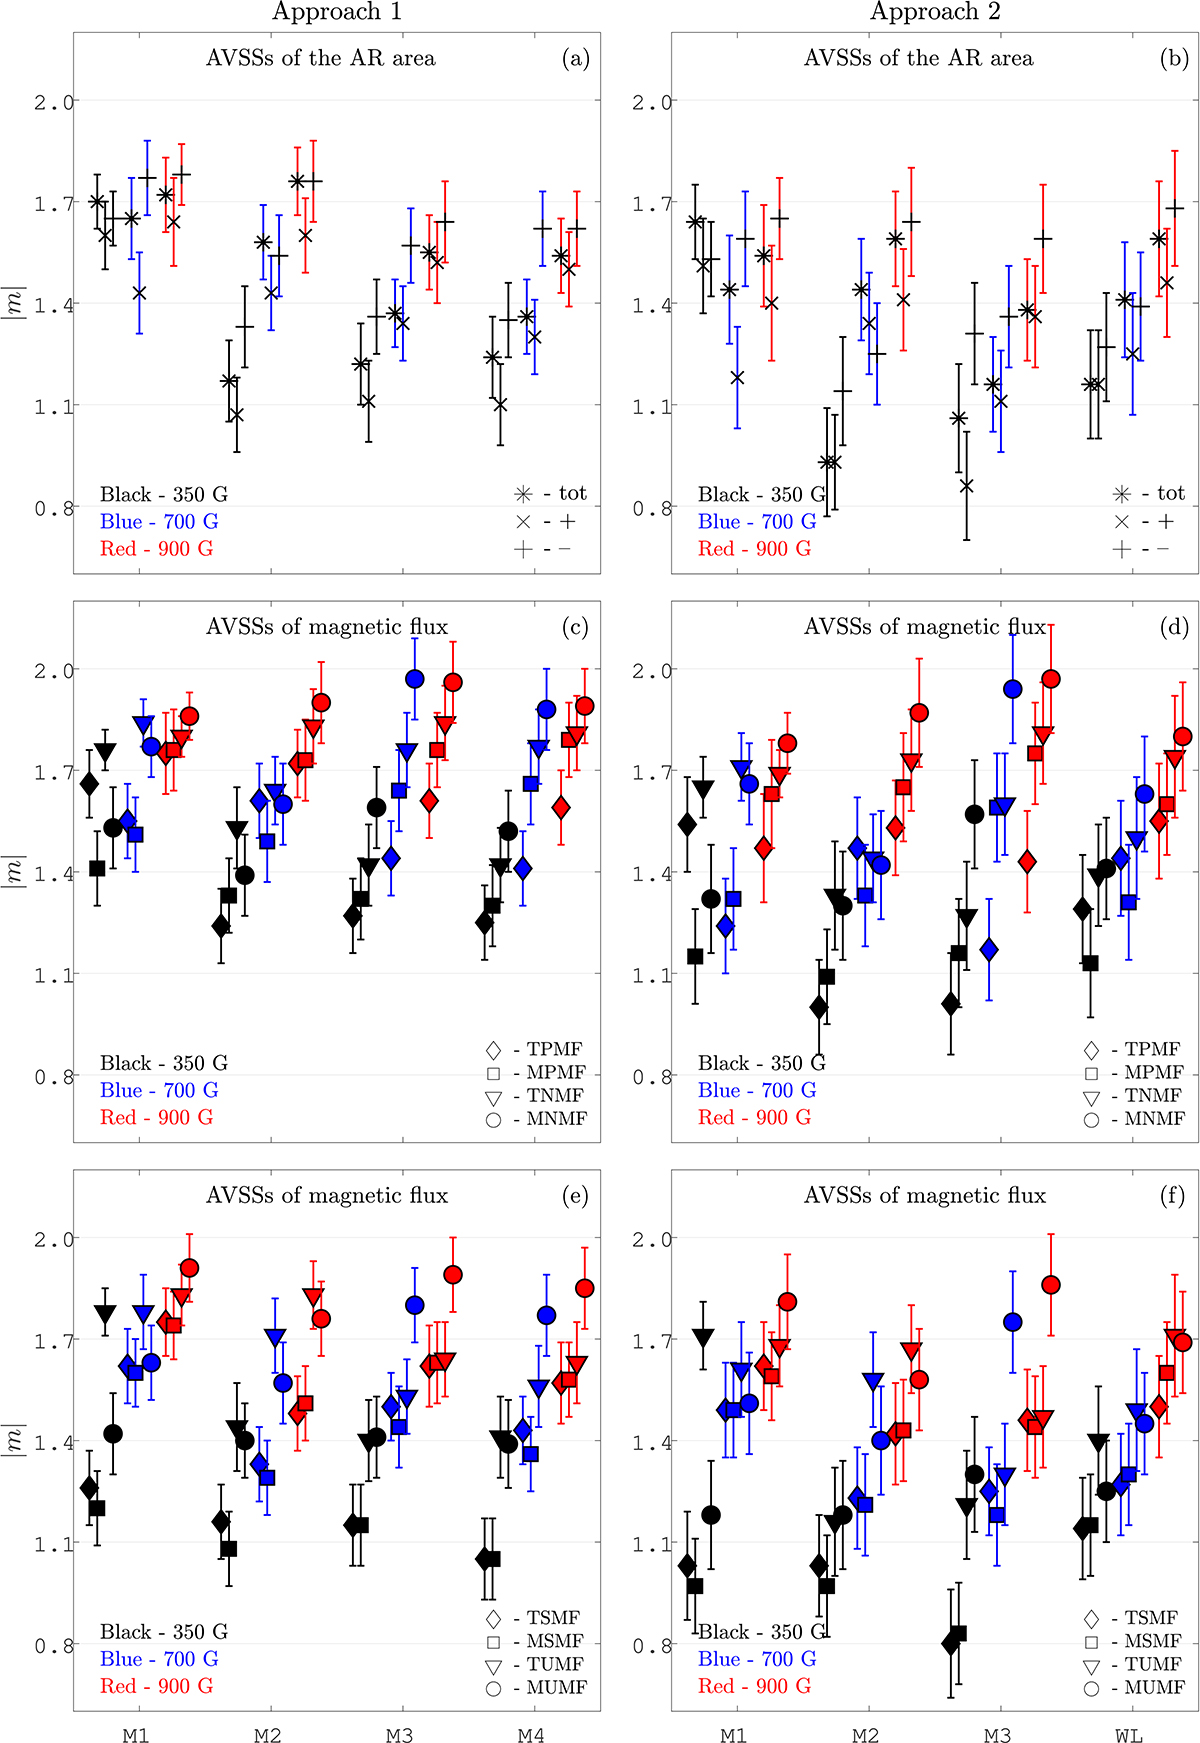
AVSSs obtained for the compact AR 12381 with approach 1 (left panels) and approach 2 (right panels). Panels (a) and (b) panels show the AVSSs of the AR area, fluctuation spectra. Panels (c) and (d) present the AVSSs of the positive and negative magnetic flux fluctuation spectra. Panels (e) and (f) show the AVSSs of the signed and unsigned magnetic flux fluctuation spectra. In panels (a) and (b), the markers ’+’ and ’×’ indicate ![]() and
and ![]() , respectively; whereas marker ’*’ denotes
, respectively; whereas marker ’*’ denotes ![]() (i.e. the combination of both polarities). In panels (c) and (d), the markers ’⋄’ and ’▫’ indicate
(i.e. the combination of both polarities). In panels (c) and (d), the markers ’⋄’ and ’▫’ indicate ![]() , while the markers ’△’ and ’°’ are used for
, while the markers ’△’ and ’°’ are used for ![]() . In panels (e) and (f), markers ’⋄’ and ’▫’ show
. In panels (e) and (f), markers ’⋄’ and ’▫’ show ![]() , while markers ’△’ and ’°’ denote
, while markers ’△’ and ’°’ denote ![]() , th ⊆ {350, 700, 900}. The colours of the markers correspond to the applied magnetic field thresholds: th = 350 G (black); th = 700 G (blue); th = 900 G (red). We note that for the sake of better visualisation, the markers in all plots are manually slightly shifted along the abscissa to avoid their overlapping.
, th ⊆ {350, 700, 900}. The colours of the markers correspond to the applied magnetic field thresholds: th = 350 G (black); th = 700 G (blue); th = 900 G (red). We note that for the sake of better visualisation, the markers in all plots are manually slightly shifted along the abscissa to avoid their overlapping.
Current usage metrics show cumulative count of Article Views (full-text article views including HTML views, PDF and ePub downloads, according to the available data) and Abstracts Views on Vision4Press platform.
Data correspond to usage on the plateform after 2015. The current usage metrics is available 48-96 hours after online publication and is updated daily on week days.
Initial download of the metrics may take a while.