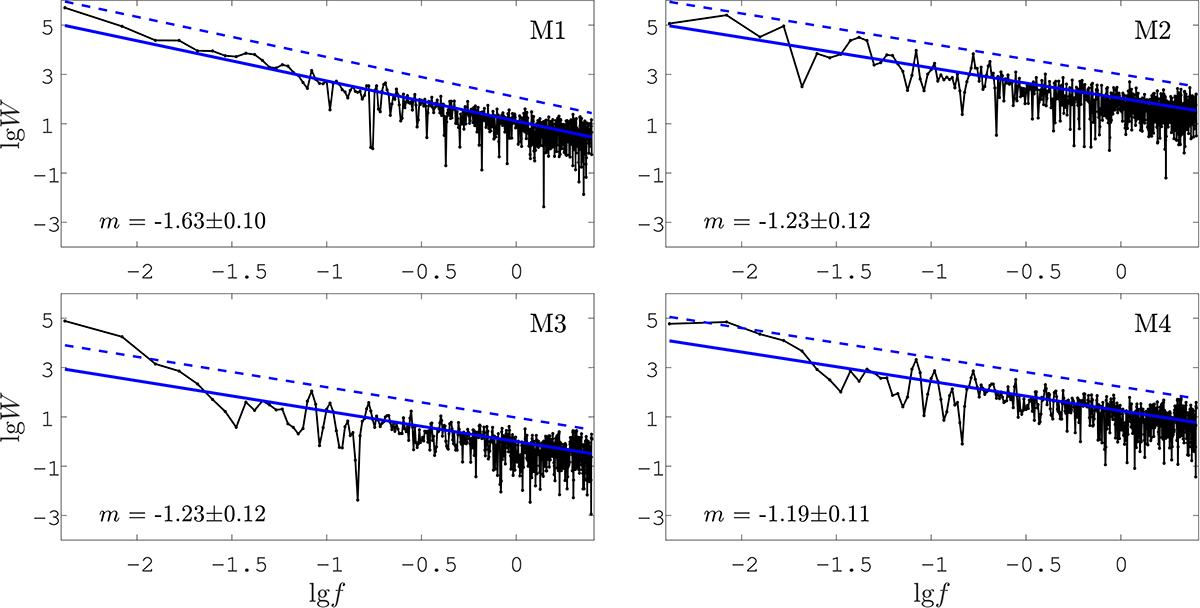
Fig. 1.
Download original image
Comparative performance of the methods M1, M2, M3, and M4, providing the fluctuation spectra of area Σ350 for AR 12524 in the entire frequency range. The particular case of threshold of th = 350 G is shown as an example. Here, the blue solid line indicates the model line with slope m that is computed by least square fitting (Eq. (1)) to the obtained power spectrum and the 95% confidence border is represented by the blue dashed line.
Current usage metrics show cumulative count of Article Views (full-text article views including HTML views, PDF and ePub downloads, according to the available data) and Abstracts Views on Vision4Press platform.
Data correspond to usage on the plateform after 2015. The current usage metrics is available 48-96 hours after online publication and is updated daily on week days.
Initial download of the metrics may take a while.