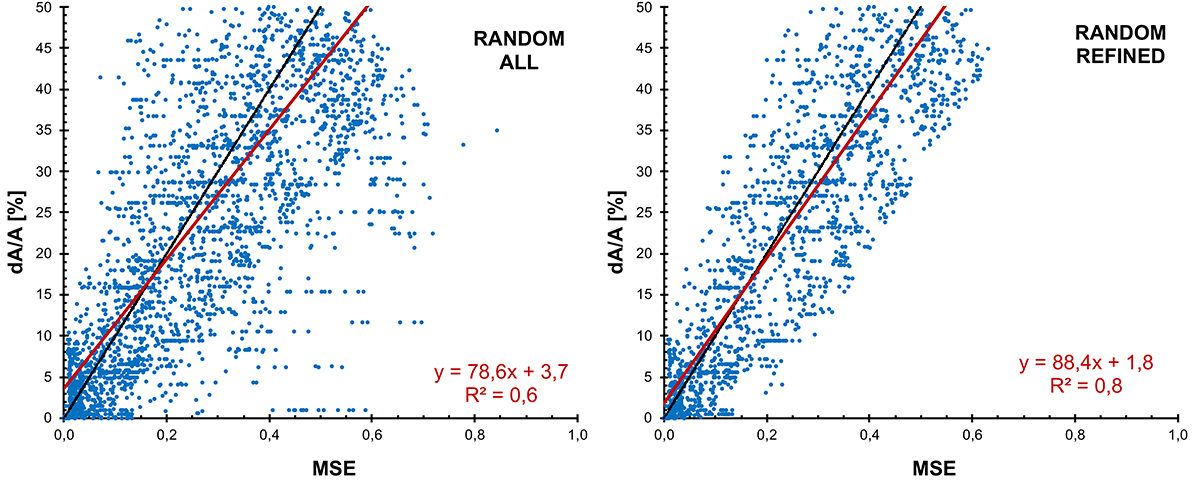
Fig. 7.
Download original image
Relative difference of the best-fit FD amplitude to the FD amplitude of the theoretical FD vs MSE for a mixture of different levels of data imperfection effects. In the left plot, no data refinement is included, whereas in the right plot data with extreme deviations from the identity line have been removed (for details, see the main text). The identity line (y = 100 * x) is marked as the solid black line in both figures, whereas the solid red line shows the linear regression line (linear regression equation and squared Pearson’s coefficient are given in red in both plots).
Current usage metrics show cumulative count of Article Views (full-text article views including HTML views, PDF and ePub downloads, according to the available data) and Abstracts Views on Vision4Press platform.
Data correspond to usage on the plateform after 2015. The current usage metrics is available 48-96 hours after online publication and is updated daily on week days.
Initial download of the metrics may take a while.