Fig. 4.
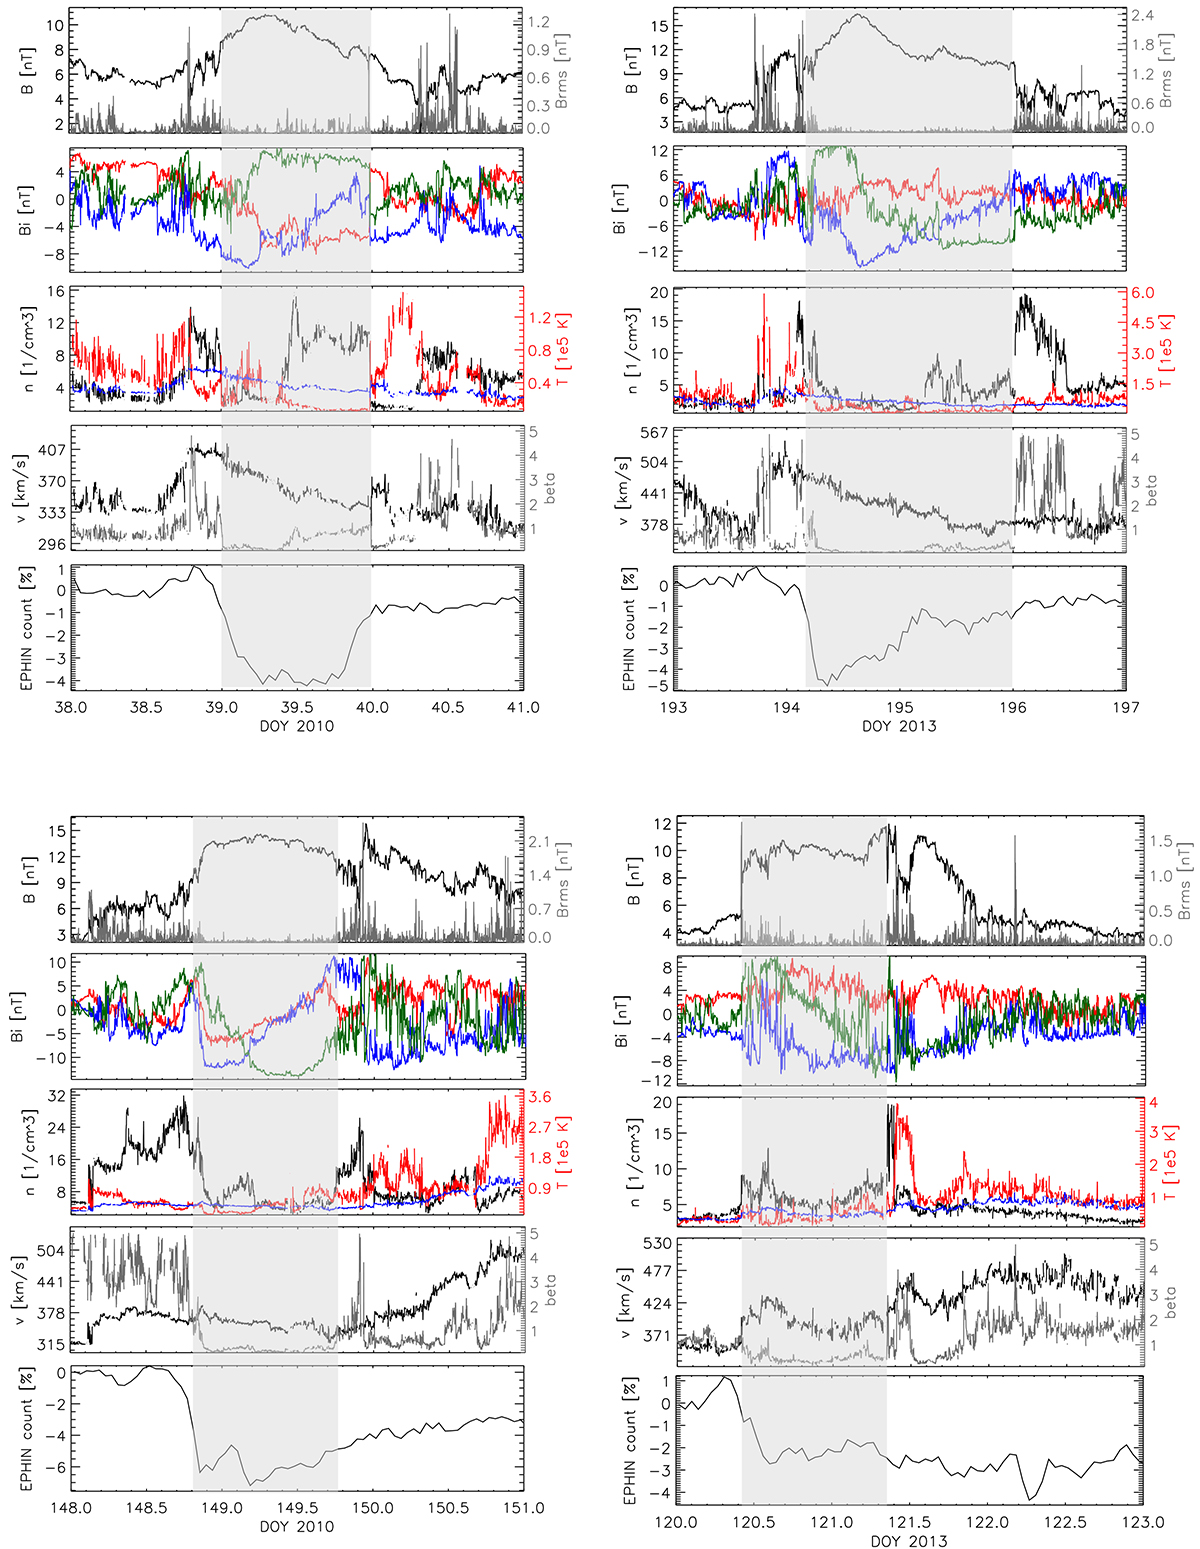
Download original image
In situ measurements of four different events assigned with four different quality indices, QI4–QI1, from top left to bottom right. Top-to-bottom panels for each event show: (1) magnetic field strength (black, in nT) and its fluctuations (grey, in nT); (2) magnetic field GSE components, x, y, and z, coloured red, blue, and green, respectively (in nT); (3) plasma density (black, in cm−3), temperature (red, in 1e5 K), and expected temperature (blue, in 1e5 K); (4) plasma flow speed (black, in km s−1) and beta (grey, non-dimensional); (5) the SOHO/EPHIN F-detector particle count (in %). The shaded region represents the magnetic obstacle, where the borders were selected according to the low-beta condition.
Current usage metrics show cumulative count of Article Views (full-text article views including HTML views, PDF and ePub downloads, according to the available data) and Abstracts Views on Vision4Press platform.
Data correspond to usage on the plateform after 2015. The current usage metrics is available 48-96 hours after online publication and is updated daily on week days.
Initial download of the metrics may take a while.