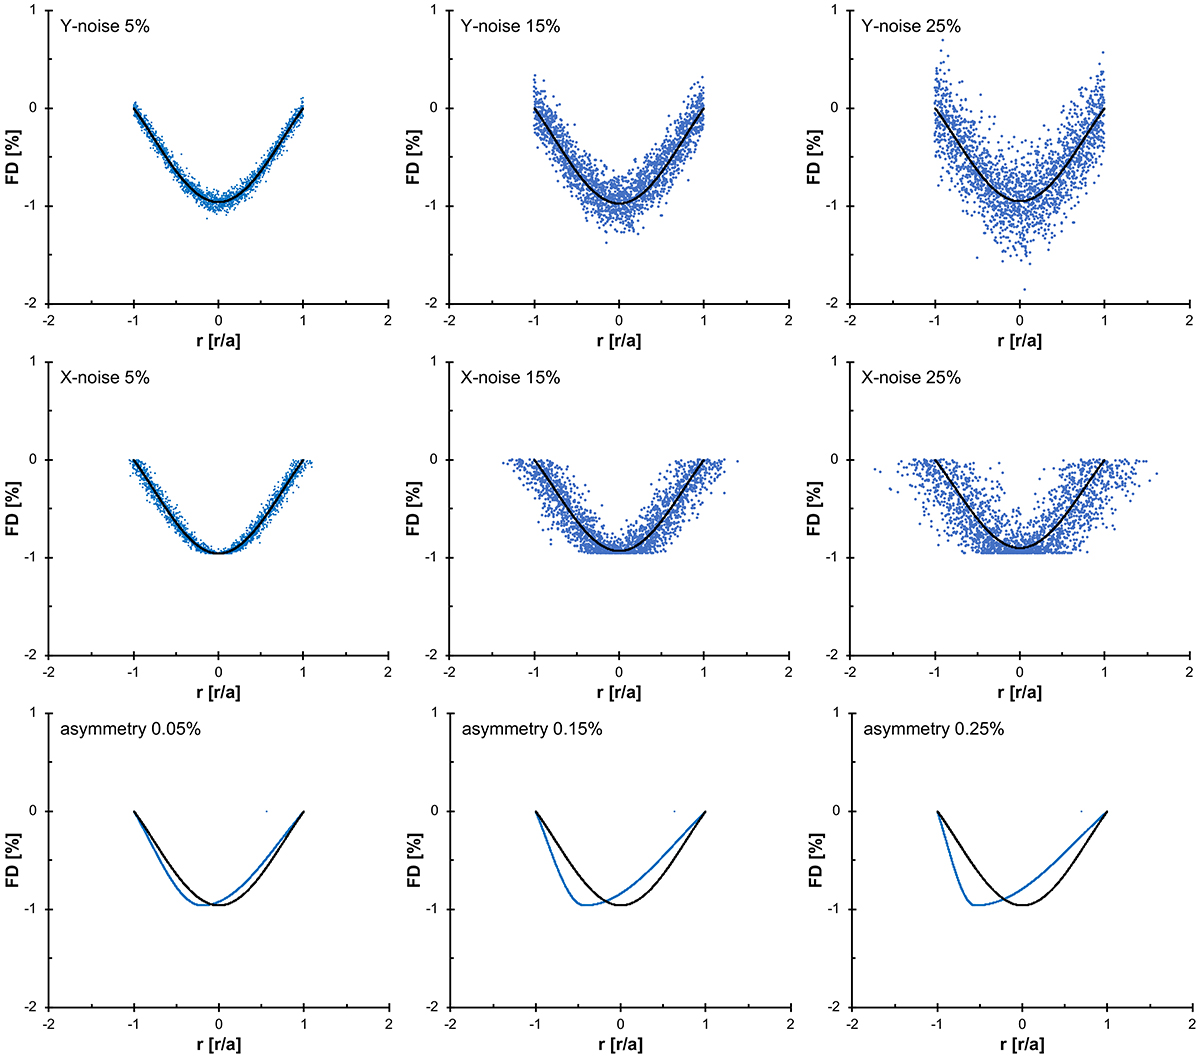
Fig. 2.
Download original image
Effects applied to the data to mimic the “imperfection” of the real measurements: Y-noise (upper panels), X-noise (middle panels), and asymmetry (lower panels) for three different levels of noise and asymmetry, respectively. The original theoretical curve is given in black, whereas the data with the applied effect are coloured blue. For details, see the main text.
Current usage metrics show cumulative count of Article Views (full-text article views including HTML views, PDF and ePub downloads, according to the available data) and Abstracts Views on Vision4Press platform.
Data correspond to usage on the plateform after 2015. The current usage metrics is available 48-96 hours after online publication and is updated daily on week days.
Initial download of the metrics may take a while.