Fig. 8.
Download original image
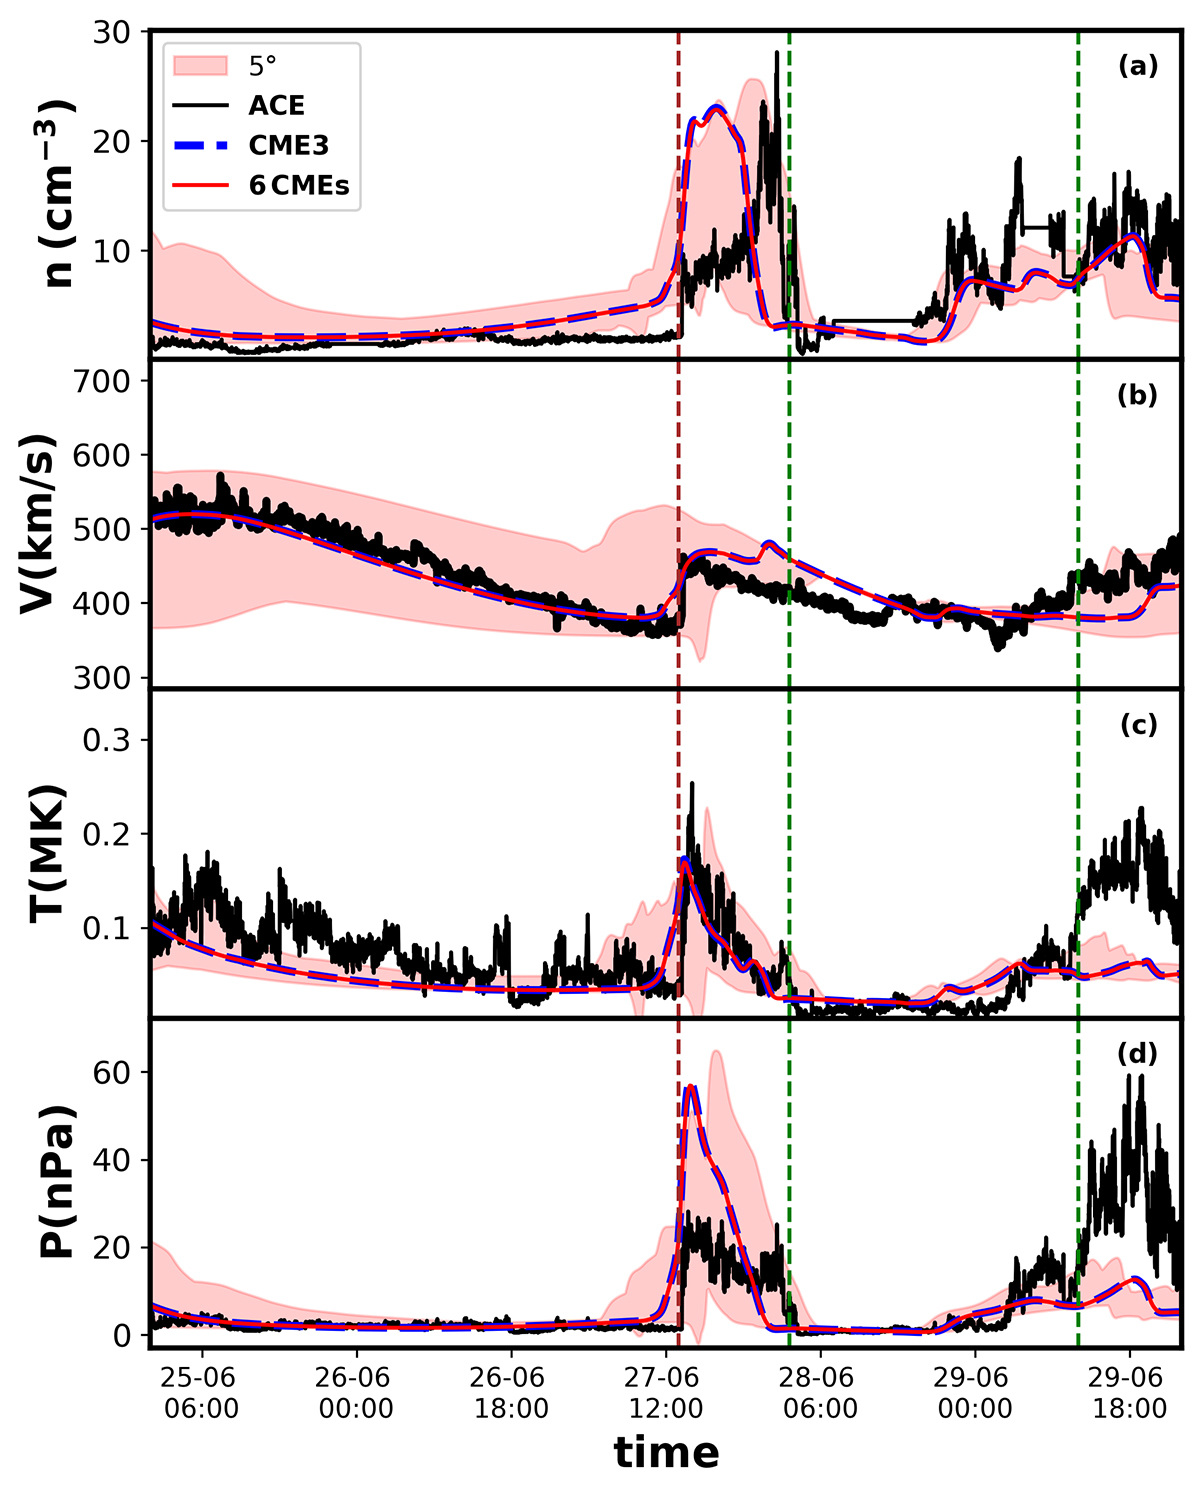
Comparison between EUHFORIA simulation results at 1 au and ACE spacecraft data. From the top panel to the bottom panel, we present the number density, solar wind bulk speed, temperature, and pressure of the solar wind. The spacecraft data are indicated with a solid black line. Results for the EUHFORIA simulation where all the CMEs are injected are indicated with a solid red line, while the EUHFORIA simulation results where only CME 3 was injected are shown with a dashed blue line. The shaded area represents the combination of the results of the plasma parameters obtained from virtual spacecraft placed at ±5° in longitude and/or latitude from Earth for the run with all the CMEs.
Current usage metrics show cumulative count of Article Views (full-text article views including HTML views, PDF and ePub downloads, according to the available data) and Abstracts Views on Vision4Press platform.
Data correspond to usage on the plateform after 2015. The current usage metrics is available 48-96 hours after online publication and is updated daily on week days.
Initial download of the metrics may take a while.