Fig. 7.
Download original image
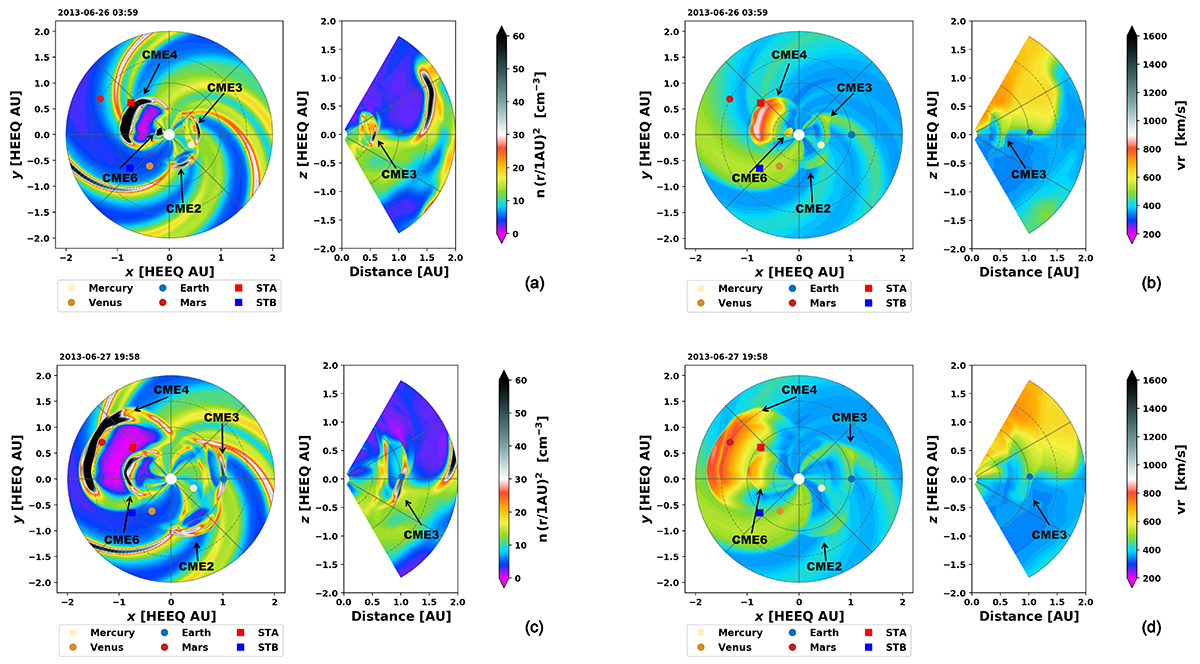
Overview of EUHFORIA results for the simulations where all the CMEs are simulated using the cone model. Scaled plasma number density (left panels) and radial velocity (right panels). The top panels correspond to 26 June at 03:59 UT, and the bottom panels correspond to 27 June at 19:58 UT. Each of the panels is composed of an equatorial slice of the simulation (left) and a meridional slice that contains Earth (right). The position of the ICMEs (CMEs) is indicated with black arrows and their associated name. As explained in the text, CME 1 is too weak, and CME 5 is out of the domain; neither of them are visible in this figure.
Current usage metrics show cumulative count of Article Views (full-text article views including HTML views, PDF and ePub downloads, according to the available data) and Abstracts Views on Vision4Press platform.
Data correspond to usage on the plateform after 2015. The current usage metrics is available 48-96 hours after online publication and is updated daily on week days.
Initial download of the metrics may take a while.