Fig. 6.
Download original image
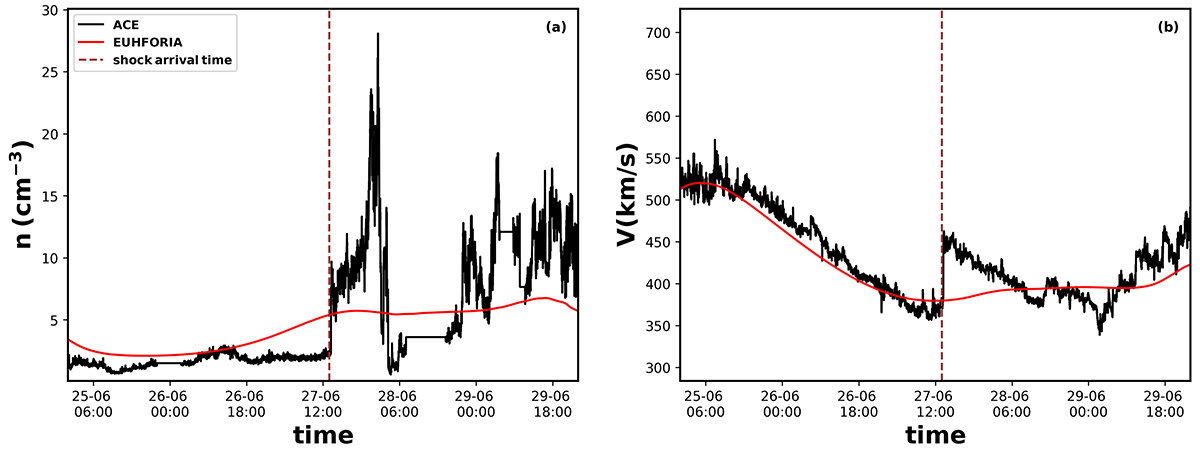
‘Best’ EUHFORIA simulation results for the background solar wind computed at L1 (red curves) between 25 and 30 June 2013 compared with in situ measurements at L1 (black curves); The left panel shows the density, and the right panel shows the solar wind speed. The best simulation was chosen by comparing several simulations obtained after slightly varying the parameters of EUHFORIA’s coronal model. We note the very good fit of the solar wind speed before the shock time preceding the ICME at L1 (vertical dashed line).
Current usage metrics show cumulative count of Article Views (full-text article views including HTML views, PDF and ePub downloads, according to the available data) and Abstracts Views on Vision4Press platform.
Data correspond to usage on the plateform after 2015. The current usage metrics is available 48-96 hours after online publication and is updated daily on week days.
Initial download of the metrics may take a while.