Fig. 4.
Download original image
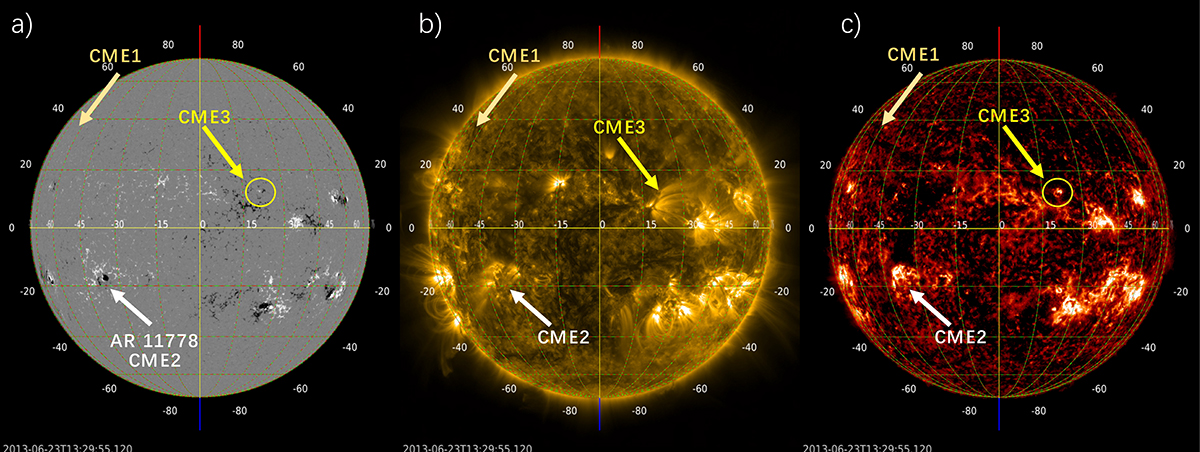
Solar disc images taken from SDO. The panels are as follows: HMI magnetogram (panel a) together with the AIA 17.1 nm and AIA 30.4 nm images (panel b and c, respectively) on 23 June 2013 at 13:29 UT. The light-pink arrow shows the approximate position of the source of CME 1. The white arrow shows the position of NOAA AR 11778, origin of CME 2, while the origin of CME 3 is marked with a yellow arrow and circle. The CME 3 source region corresponds to a tiny emerging flux at the edge of a filament channel.
Current usage metrics show cumulative count of Article Views (full-text article views including HTML views, PDF and ePub downloads, according to the available data) and Abstracts Views on Vision4Press platform.
Data correspond to usage on the plateform after 2015. The current usage metrics is available 48-96 hours after online publication and is updated daily on week days.
Initial download of the metrics may take a while.