Fig. 2.
Download original image
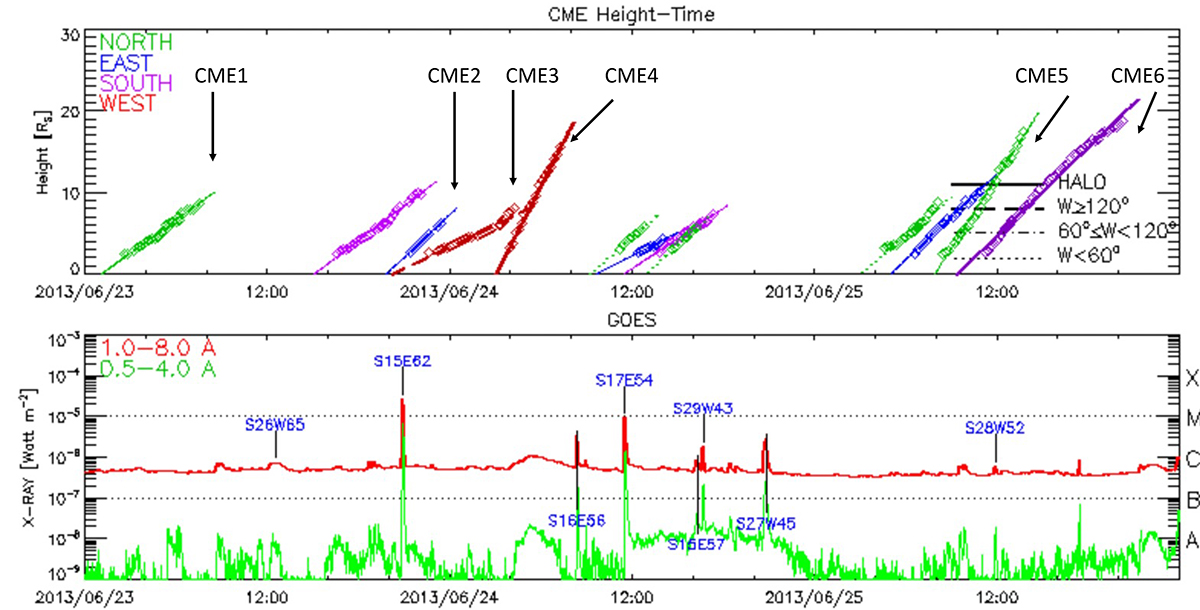
CME characteristics. The top panel shows the height-time plots, and the six CMEs studied in this article are marked with arrows. The colours code the main CME direction (see left inset), while the type of lines codes the CME apparent angular extension (see right inset). The bottom panel shows the GOES X-ray flux in two wavelengths with the solar source coordinates of the identified events. The time range is from 23 June 00:00 UT to 25 June 24:00 UT (adapted from the CDAW catalogue).
Current usage metrics show cumulative count of Article Views (full-text article views including HTML views, PDF and ePub downloads, according to the available data) and Abstracts Views on Vision4Press platform.
Data correspond to usage on the plateform after 2015. The current usage metrics is available 48-96 hours after online publication and is updated daily on week days.
Initial download of the metrics may take a while.