Fig. 1.
Download original image
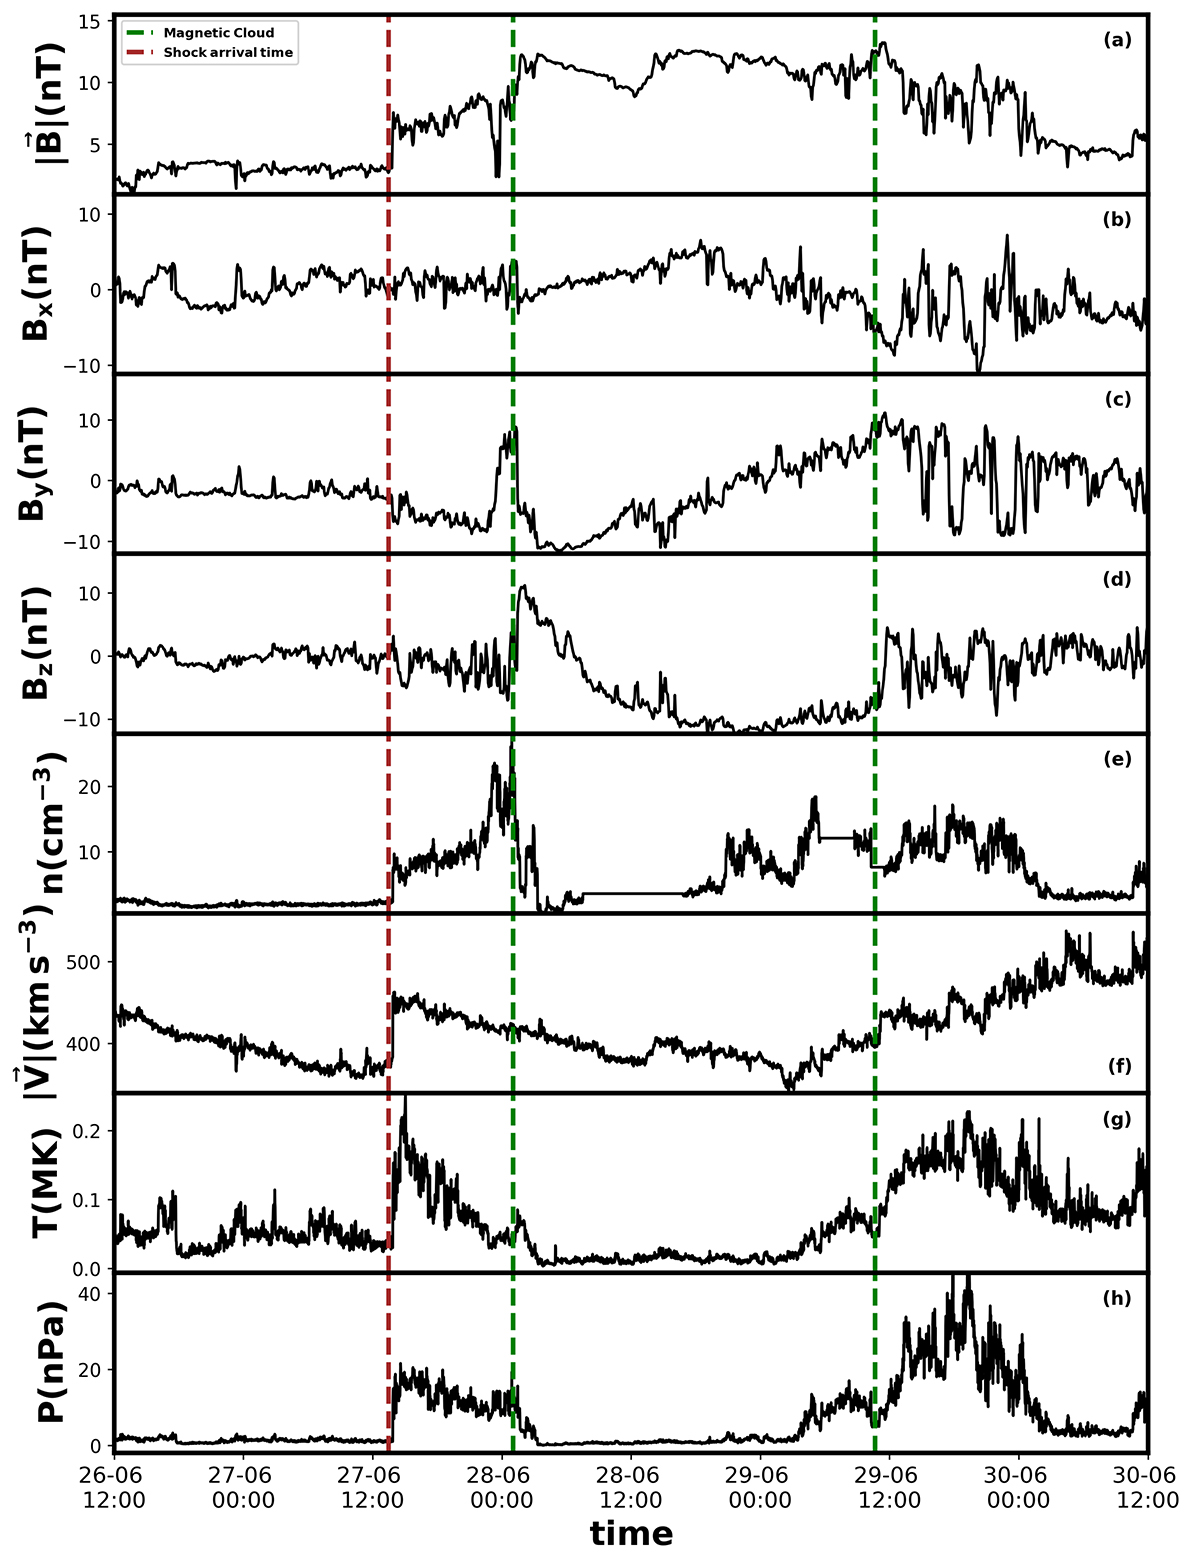
In situ observations from ACE spacecraft at L1 between 26 June at 12:00 UT and 30 June 2013 at 12:00 UT. Panels are as follows: profiles of the magnetic field magnitude (panel a), the three components (Bx, By, and Bz in panels b, c, and d, respectively), density (panel e), bulk speed (panel f), temperature (panel g), and gas pressure (panel h). The red vertical dashed line indicates the shock arrival time, and the two green vertical dashed lines mark the start and the end of the MC.
Current usage metrics show cumulative count of Article Views (full-text article views including HTML views, PDF and ePub downloads, according to the available data) and Abstracts Views on Vision4Press platform.
Data correspond to usage on the plateform after 2015. The current usage metrics is available 48-96 hours after online publication and is updated daily on week days.
Initial download of the metrics may take a while.