Fig. 7.
Download original image
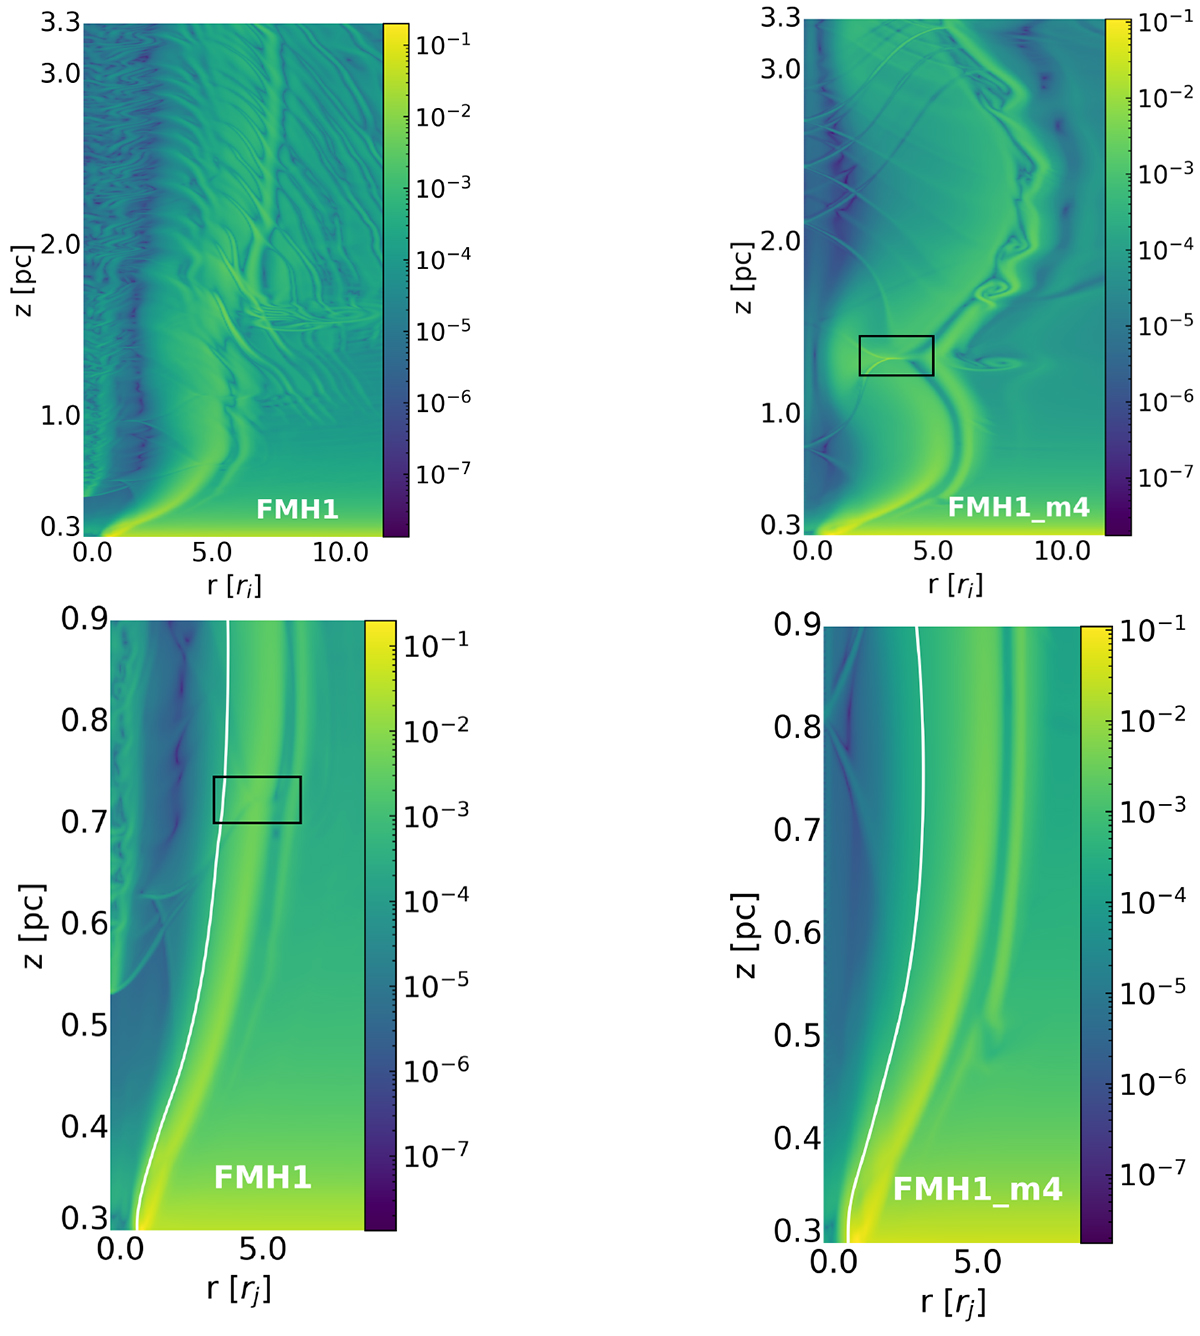
Modulus of the gradient of the rest-mass density (in logarithmic scale) for models FMH1 (left panels) and FMH1_m4 (right panels). The upper panels show the entire grid, while in the bottom ones we show a zoom-in in the 0.3–0.9 pc region. The modulus of the gradient of the rest-mass density highlights the location of steep sound waves and shock waves. The black squares highlight the triple point associated with the incident/reflected/Mach shocks in the jet-ambient transition surface (for details, see Sect. 4.3). In the bottom panels, the contours represent the tracer at the level f = 0.9, showing the transition between the inner jet and the shear layer.
Current usage metrics show cumulative count of Article Views (full-text article views including HTML views, PDF and ePub downloads, according to the available data) and Abstracts Views on Vision4Press platform.
Data correspond to usage on the plateform after 2015. The current usage metrics is available 48-96 hours after online publication and is updated daily on week days.
Initial download of the metrics may take a while.