Open Access
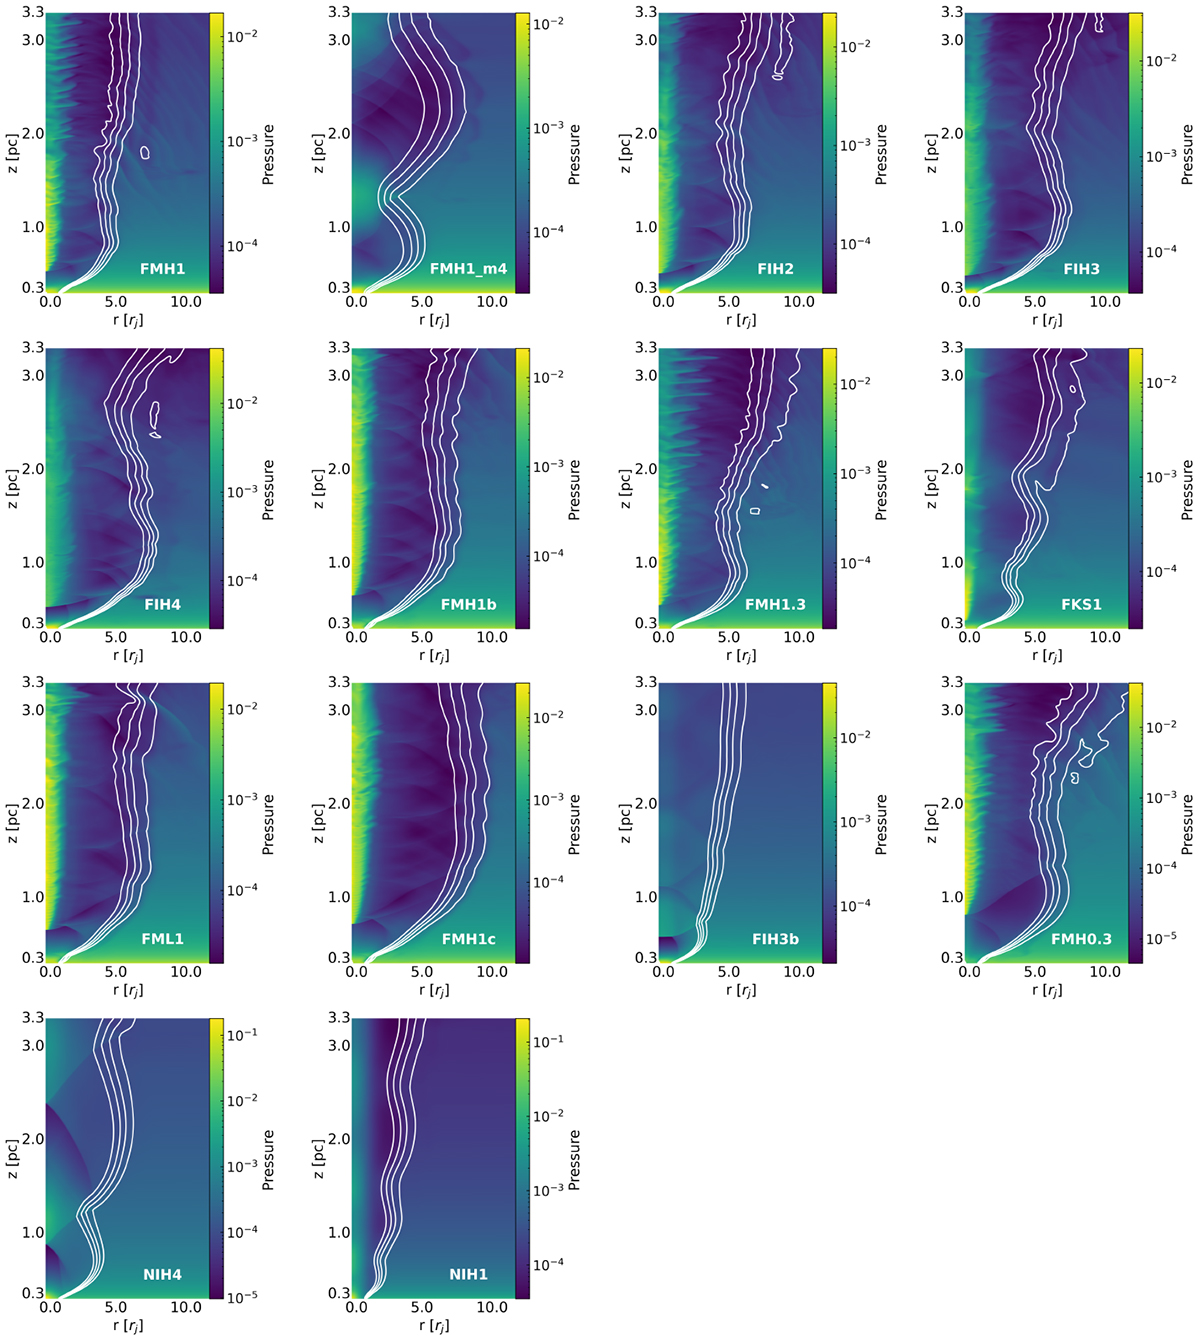
Fig. 6.
Download original image
Pressure maps for the simulated models. The white contours are representative of the tracer at levels of 0.2, 0.4, 0.6, 0.8. As in Fig. 5 the different jet nature leads to the different pressure profiles in the spine and in the shear layer regions.
Current usage metrics show cumulative count of Article Views (full-text article views including HTML views, PDF and ePub downloads, according to the available data) and Abstracts Views on Vision4Press platform.
Data correspond to usage on the plateform after 2015. The current usage metrics is available 48-96 hours after online publication and is updated daily on week days.
Initial download of the metrics may take a while.