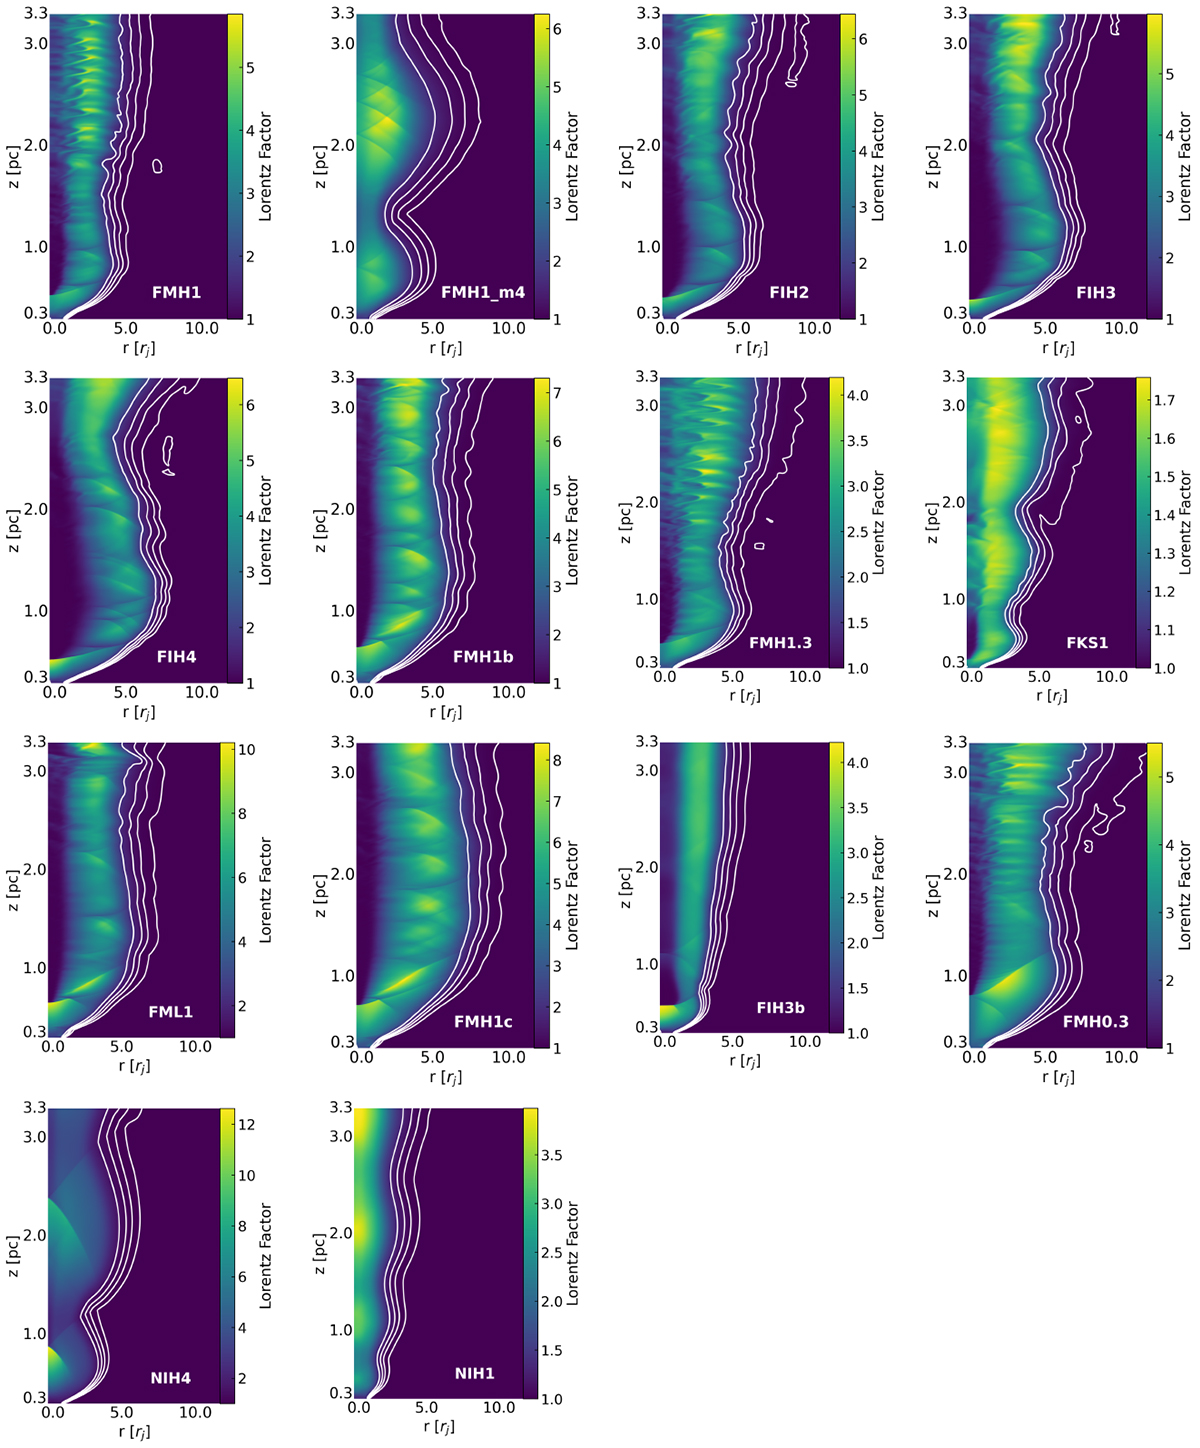
Fig. 5.
Download original image
Lorentz factor maps for the simulated models. The white contours are representative of the tracer at levels of 0.2, 0.4, 0.6, 0.8. The results show the clear correlation between the the jet speed profiles and the intrinsic properties, with the main differences shown between force-free and nonforce-free along with magnetically dominated or internally dominated models. For details, see the text.
Current usage metrics show cumulative count of Article Views (full-text article views including HTML views, PDF and ePub downloads, according to the available data) and Abstracts Views on Vision4Press platform.
Data correspond to usage on the plateform after 2015. The current usage metrics is available 48-96 hours after online publication and is updated daily on week days.
Initial download of the metrics may take a while.