Fig. 2.
Download original image
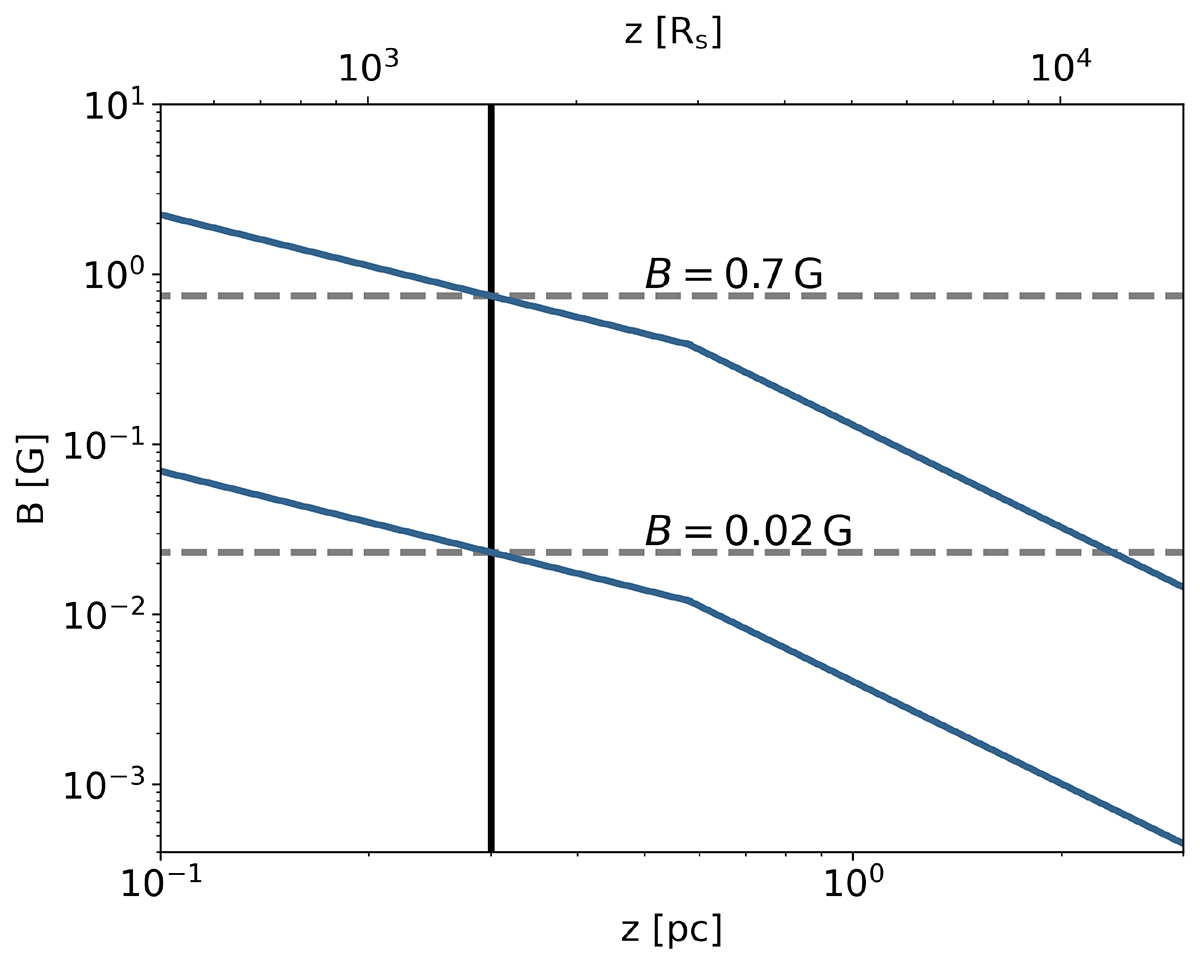
Expected magnetic field distribution between 0.1 pc and 3 pc. The upper and lower magnetic field limits are extrapolated from the core shift measurement under the different assumption (for the details see Ricci et al. 2022). The black vertical line highlights the starting point of zi = 0.3 pc of our simulations, while the horizontal dashed lines are the expected range of magnetic field at zi.
Current usage metrics show cumulative count of Article Views (full-text article views including HTML views, PDF and ePub downloads, according to the available data) and Abstracts Views on Vision4Press platform.
Data correspond to usage on the plateform after 2015. The current usage metrics is available 48-96 hours after online publication and is updated daily on week days.
Initial download of the metrics may take a while.