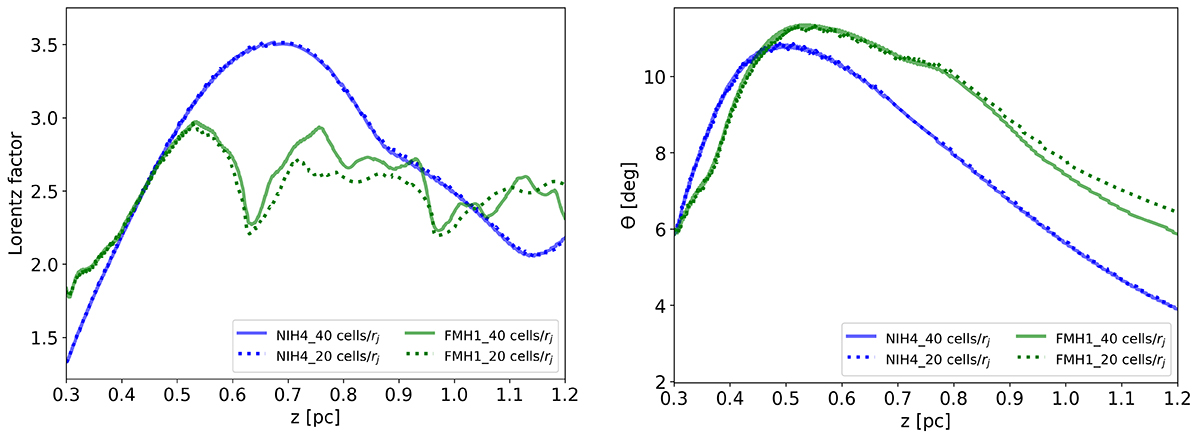
Fig. C.1.
Download original image
Comparison of the profiles obtained from simulations at the resolution of 20 and 40 cells/rj. Left panel: Lorentz factor evolution up to 1.2 pc for models FMH1 and NIH4. Right panel: Half-opening angle obtained in the same models. Blue lines are for model NIH4 (continuous - 40 cells/rj; dotted - 20 cells/rj) while green lines are for model FMH1 (same line-style scheme). The comparison shows how the resolution of 20 cells/rj is enough to reach the saturation point, allowing us to use this resolution value for our simulations.
Current usage metrics show cumulative count of Article Views (full-text article views including HTML views, PDF and ePub downloads, according to the available data) and Abstracts Views on Vision4Press platform.
Data correspond to usage on the plateform after 2015. The current usage metrics is available 48-96 hours after online publication and is updated daily on week days.
Initial download of the metrics may take a while.