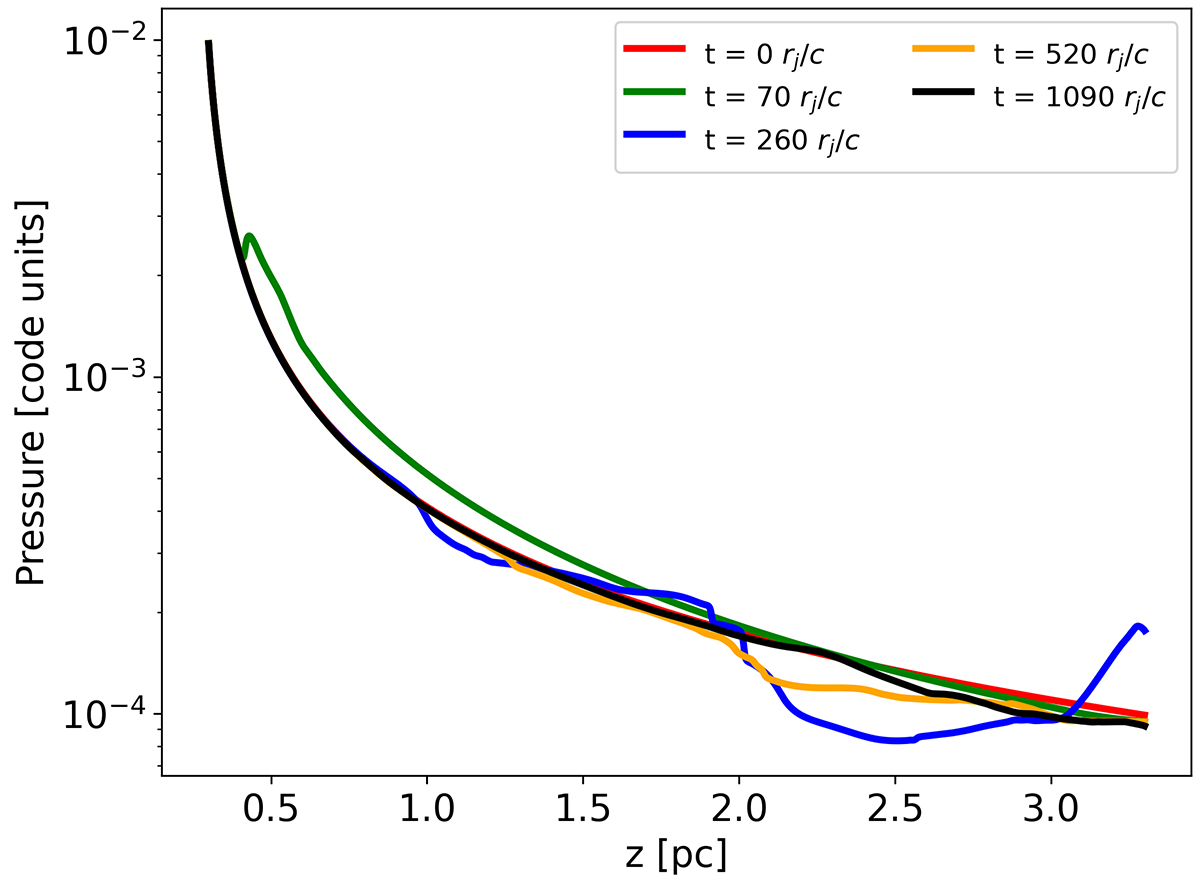
Fig. B.2.
Download original image
Ambient pressure evolution along the axial direction for the different time steps of t = 0 rj/c (red line), t = 70 rj/c (green line), t = 280 rj/c (blue line), t = 520 rj/c (orange line), and t = 1090 rj/c (black line). In the intermediate time steps, the oscillations in the pressure values are due to the passage of the wave. After enough time, such oscillations are absorbed by the boundary conditions and the original profile is recovered.
Current usage metrics show cumulative count of Article Views (full-text article views including HTML views, PDF and ePub downloads, according to the available data) and Abstracts Views on Vision4Press platform.
Data correspond to usage on the plateform after 2015. The current usage metrics is available 48-96 hours after online publication and is updated daily on week days.
Initial download of the metrics may take a while.