Open Access
Fig. 16
Download original image
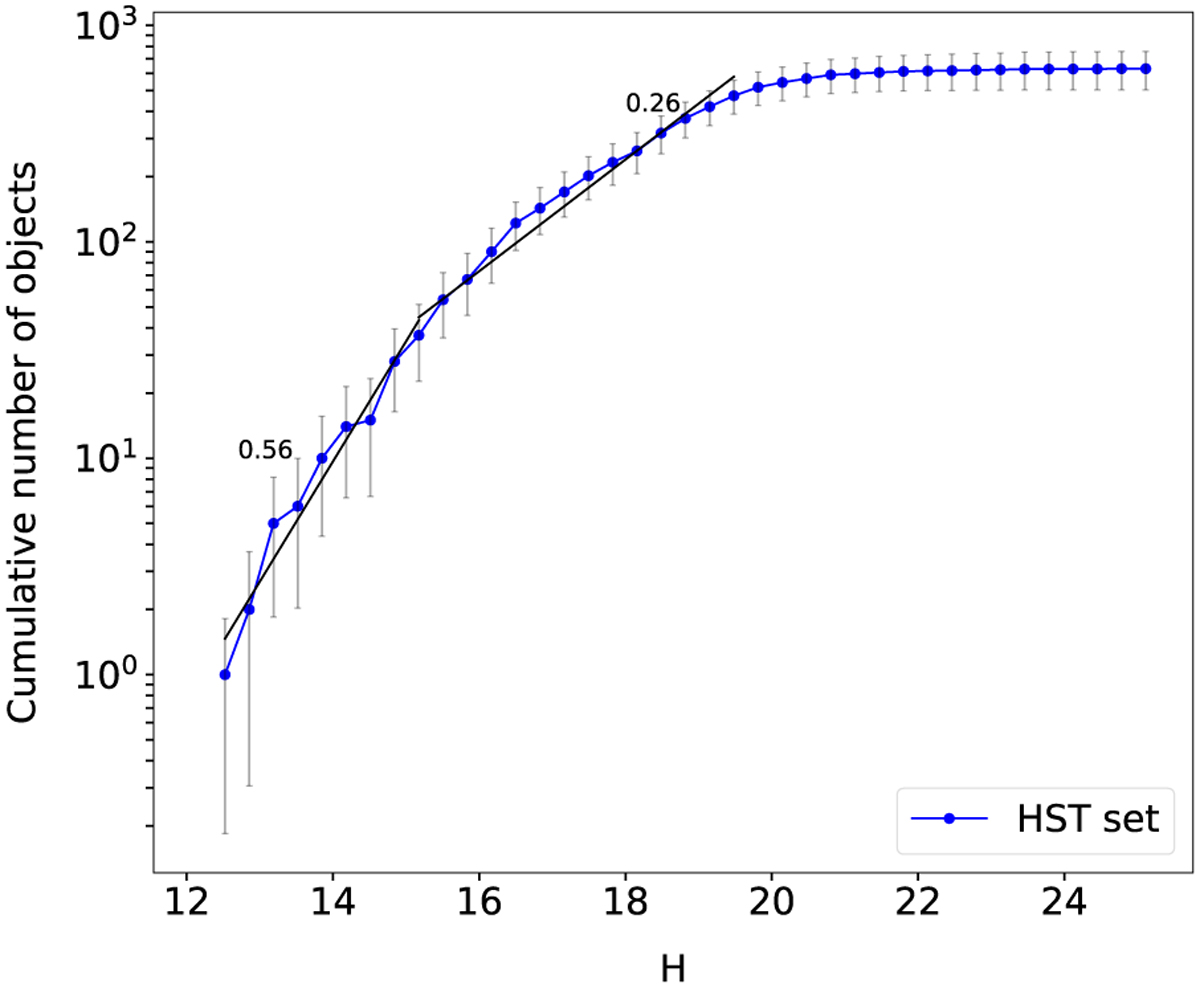
Absolute magnitude cumulative size distribution for our HST dataset. The black lines and numerical values represent the calculated approximate equivalent slopes α for log N(H > H0) ∝ α log(H0).
Current usage metrics show cumulative count of Article Views (full-text article views including HTML views, PDF and ePub downloads, according to the available data) and Abstracts Views on Vision4Press platform.
Data correspond to usage on the plateform after 2015. The current usage metrics is available 48-96 hours after online publication and is updated daily on week days.
Initial download of the metrics may take a while.