Fig. 18
Download original image
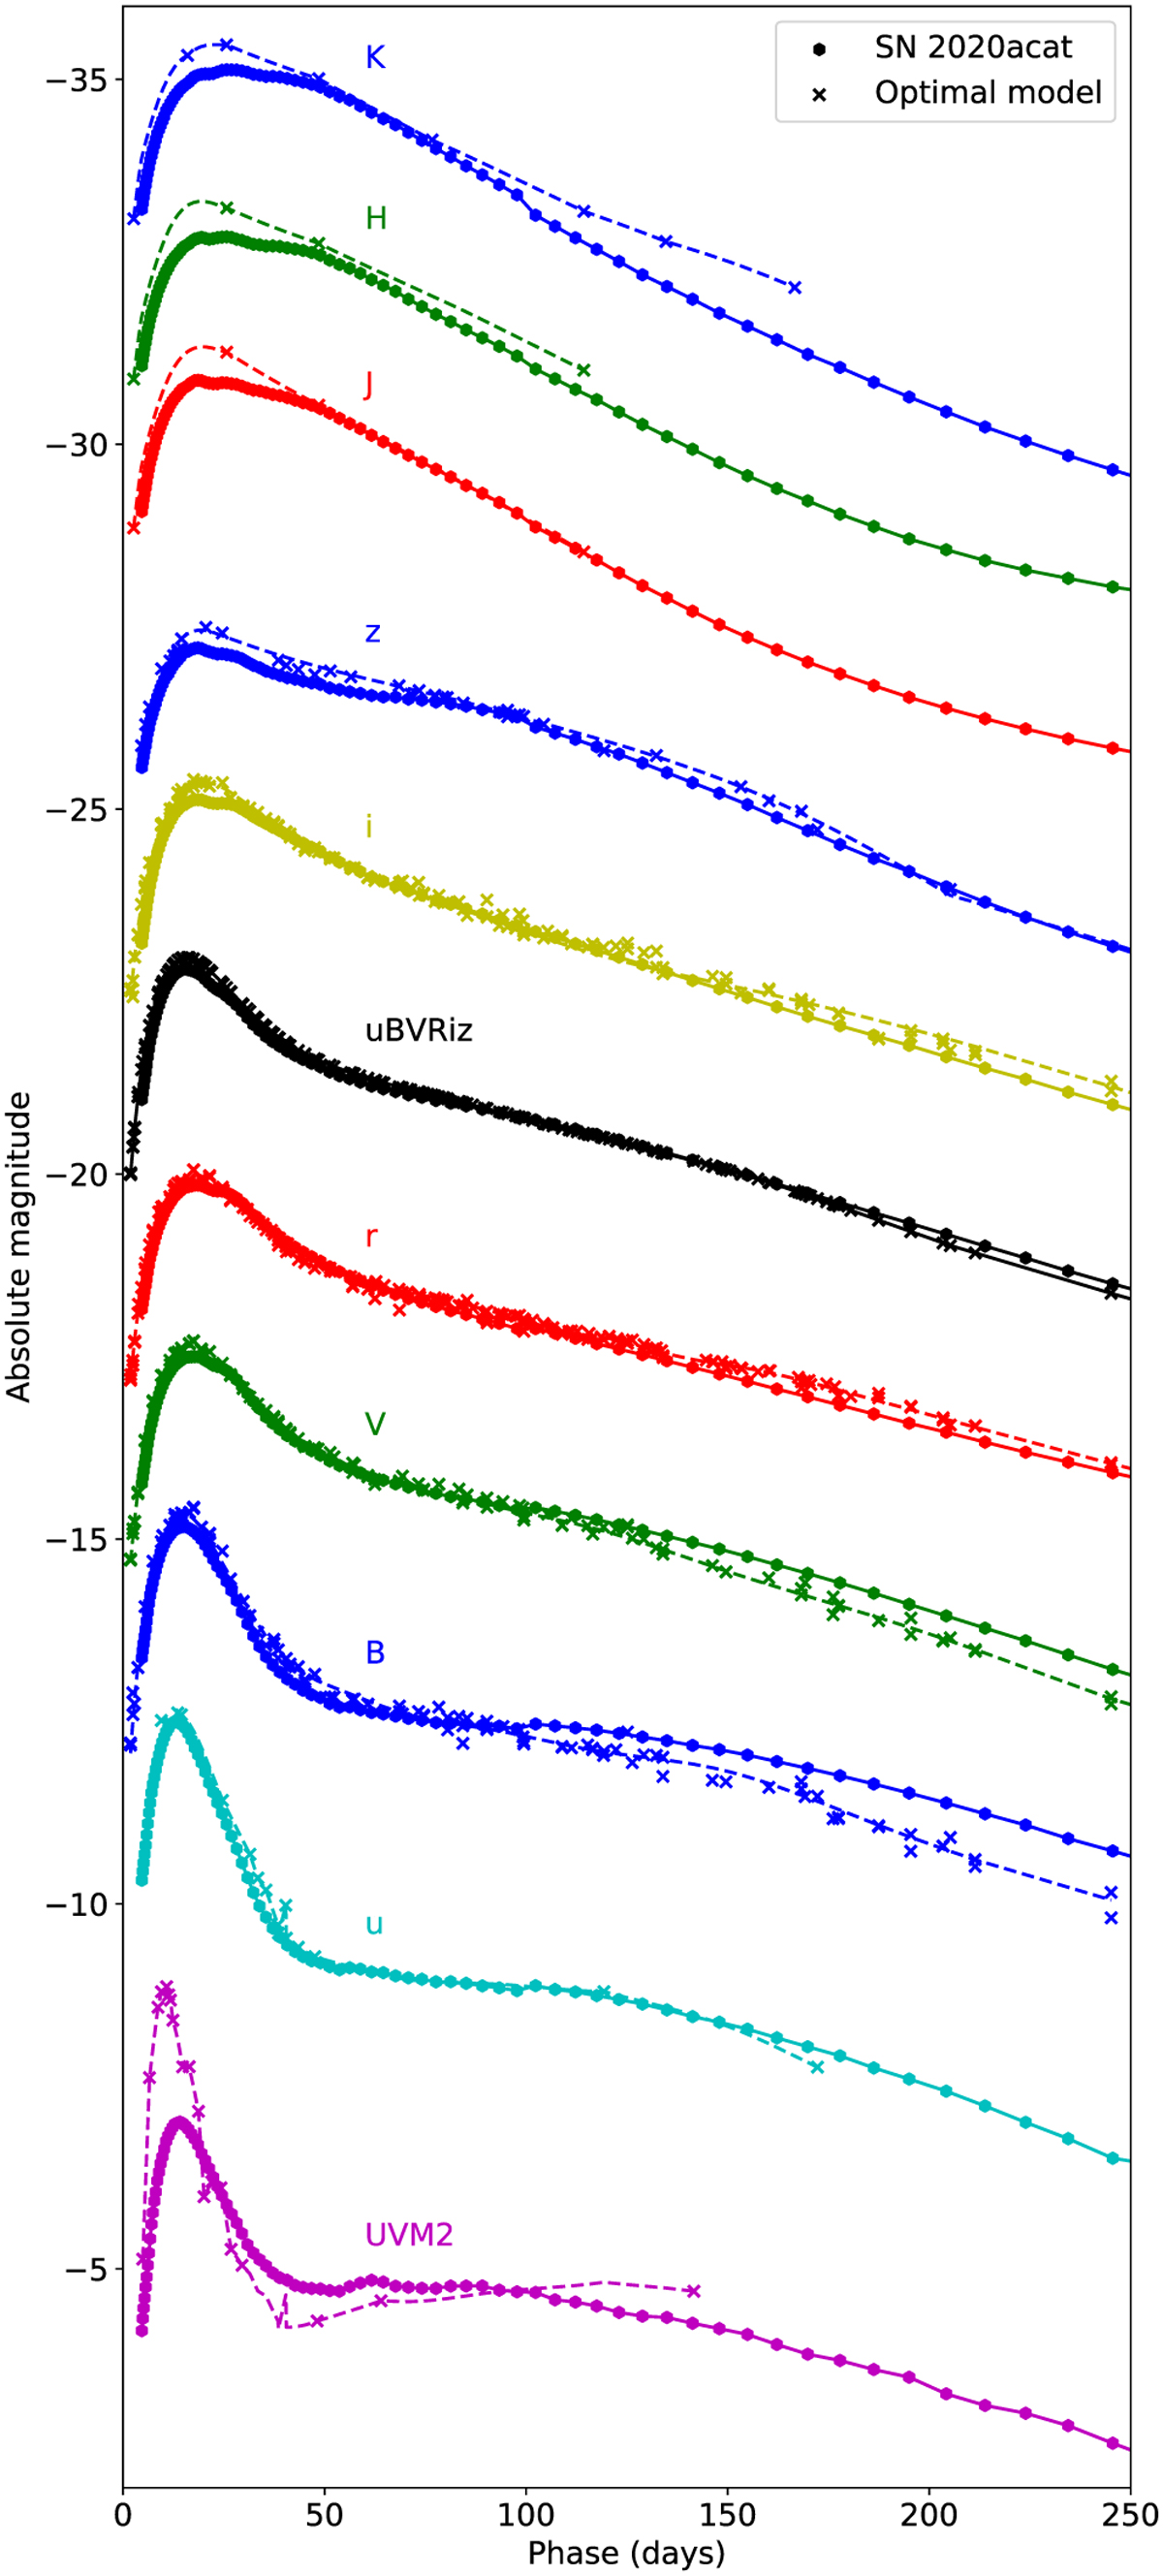
Broad-band and bolometric light curves until 250 days for the optimal model (M17-s-s-XH-low; solid lines and circles) compared to the observations of SN 2020acat (dashed lines and crosses). From bottom to top, we show the UVM2 (magenta), u (cyan), B (blue), V (green), r (red), ugBVriz pseudo-bolometric (black), i (yellow), z (blue), J (red), H (green), and K (blue) light curves. They are shifted for clarity by 6.0, 4.3, 2.0, 0.0, −2.3, −5.7, −7.7, −10.0, −13.0, −15.0, and −17.0 mags, respectively.
Current usage metrics show cumulative count of Article Views (full-text article views including HTML views, PDF and ePub downloads, according to the available data) and Abstracts Views on Vision4Press platform.
Data correspond to usage on the plateform after 2015. The current usage metrics is available 48-96 hours after online publication and is updated daily on week days.
Initial download of the metrics may take a while.