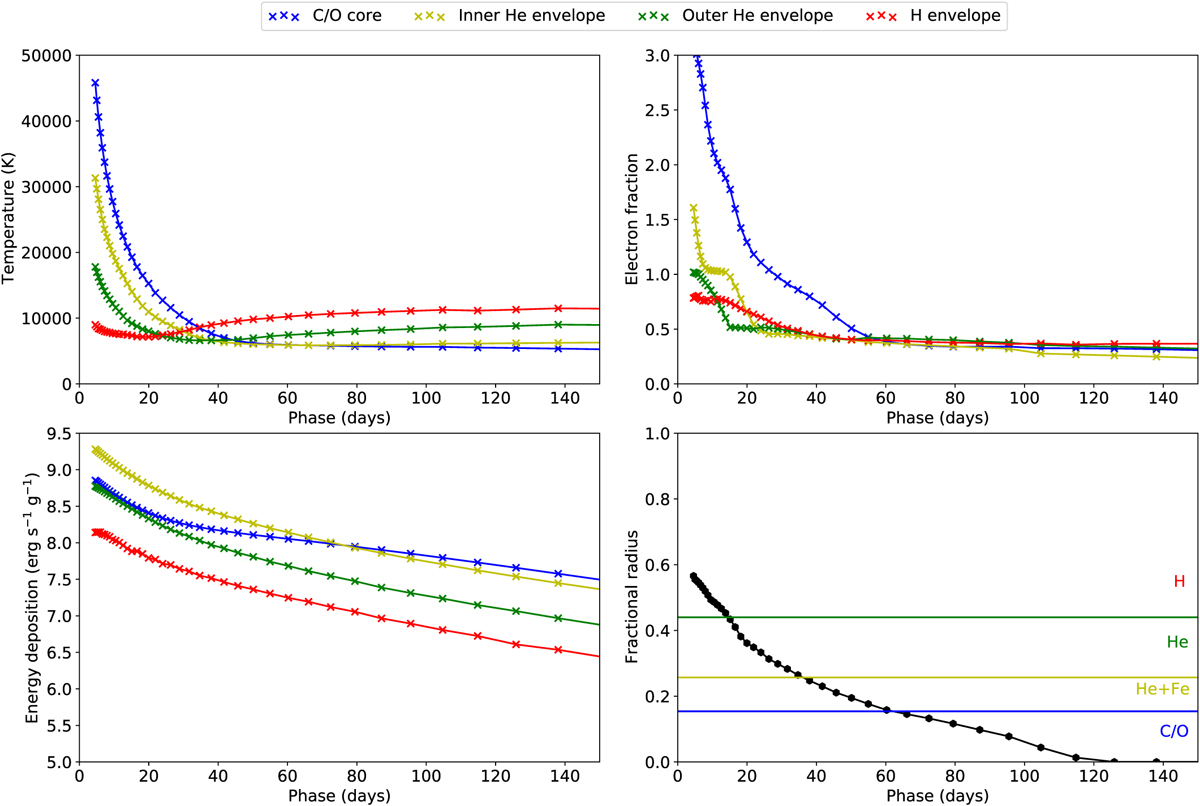
Fig. 16
Download original image
Evolution of the temperature (upper left panel), electron fraction (upper right panel), and radioactive energy deposition (lower left panel) in the oxygen core (blue), in the inner and outer (yellow and green) helium envelope, and in the hydrogen envelope (red) for the optimal model (M17-s-s-XH-low). In the lower right panel, we show the evolution of the (Rosseland mean) continuum photosphere (black) and the outer borders of the carbon-oxygen core (blue) and the inner and outer (green and yellow) helium envelope.
Current usage metrics show cumulative count of Article Views (full-text article views including HTML views, PDF and ePub downloads, according to the available data) and Abstracts Views on Vision4Press platform.
Data correspond to usage on the plateform after 2015. The current usage metrics is available 48-96 hours after online publication and is updated daily on week days.
Initial download of the metrics may take a while.