Fig. B.1
Download original image
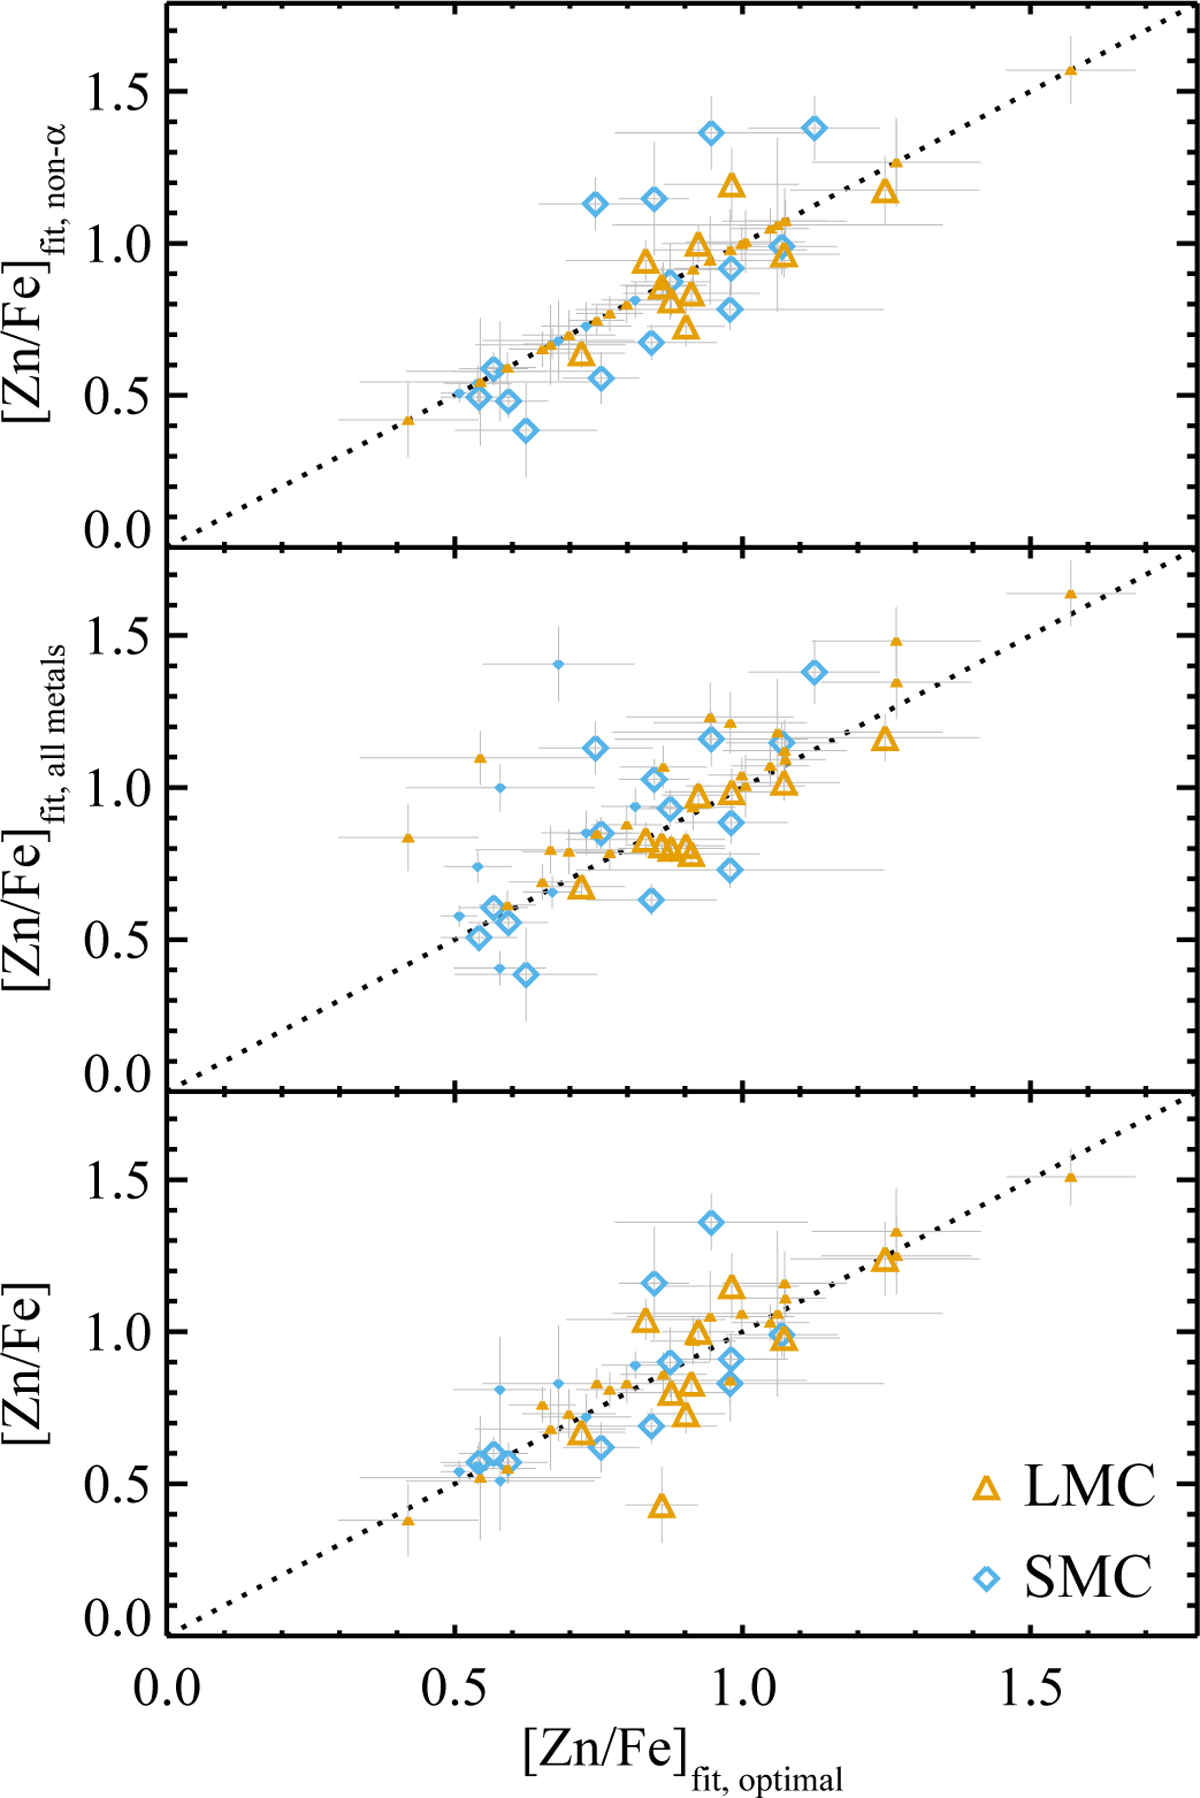
Comparison between the overall strength of the dust depletion [Zn/Fe]fit from the fit to the abundance patterns for the optimal choice of metals (see Sect. 3) with the observed [Zn/Fe] (bottom panel), the fit to all metals (middle panel), and the fit to only the non-α-elements. Orange triangles show the measurements for the LMC and blue diamonds those for the SMC. The dotted curve is the x = y line. Larger symbols highlight the golden sample.
Current usage metrics show cumulative count of Article Views (full-text article views including HTML views, PDF and ePub downloads, according to the available data) and Abstracts Views on Vision4Press platform.
Data correspond to usage on the plateform after 2015. The current usage metrics is available 48-96 hours after online publication and is updated daily on week days.
Initial download of the metrics may take a while.