Fig. A.1.
Download original image
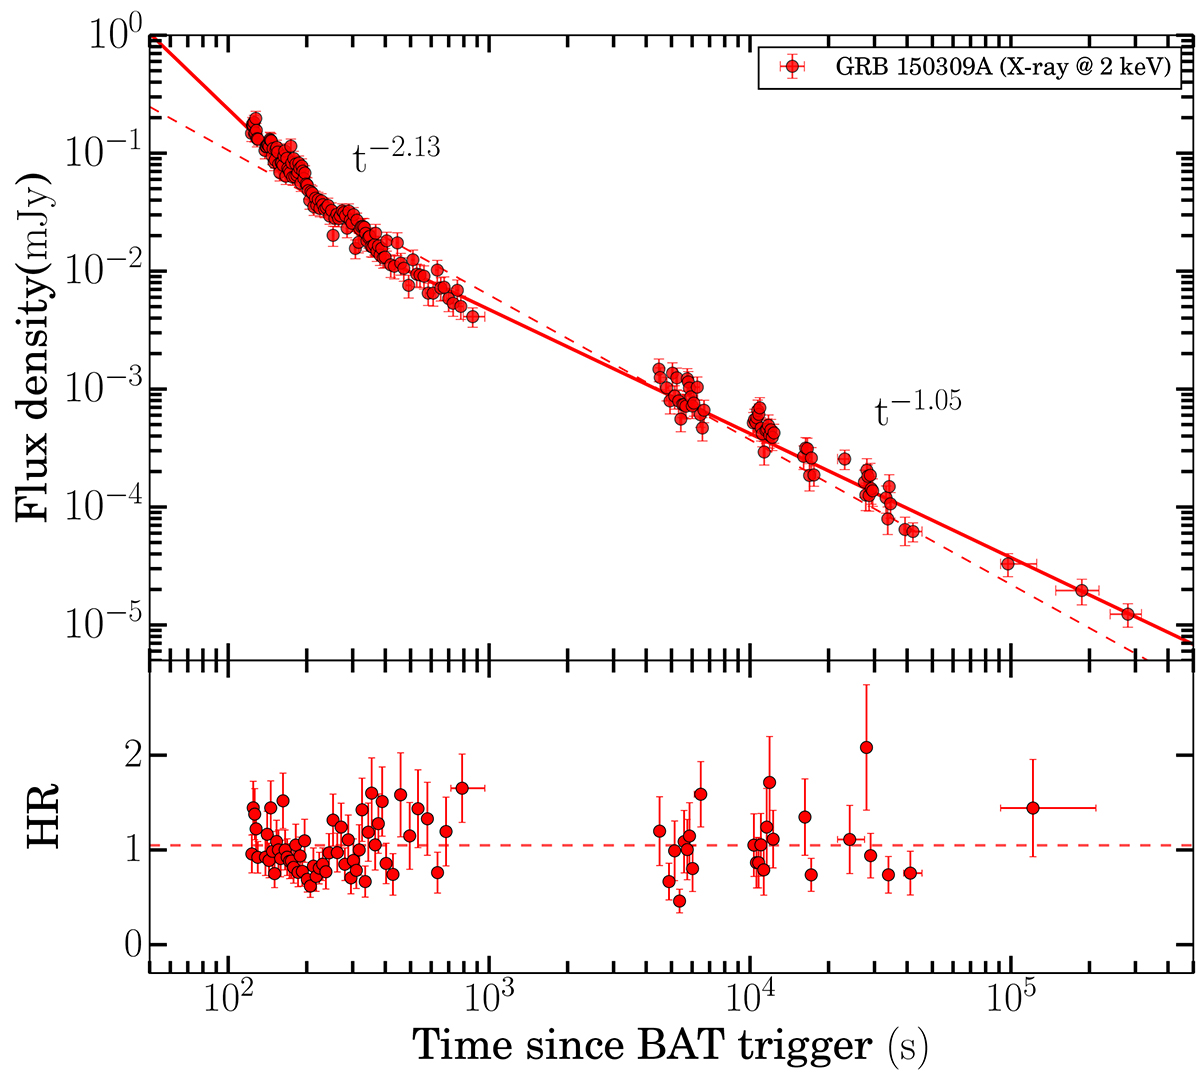
X-ray flux light curve of GRB 150309A. Top panel: XRT flux light curves at the 2 keV energy range. The light curve has been fitted with power-law and broken power-law (best fit) models. Bottom panel: Evolution of hardness ratio in the XRT energy channel. The dashed vertical red line indicates the mean value of the hardness ratio for GRB 150309A.
Current usage metrics show cumulative count of Article Views (full-text article views including HTML views, PDF and ePub downloads, according to the available data) and Abstracts Views on Vision4Press platform.
Data correspond to usage on the plateform after 2015. The current usage metrics is available 48-96 hours after online publication and is updated daily on week days.
Initial download of the metrics may take a while.