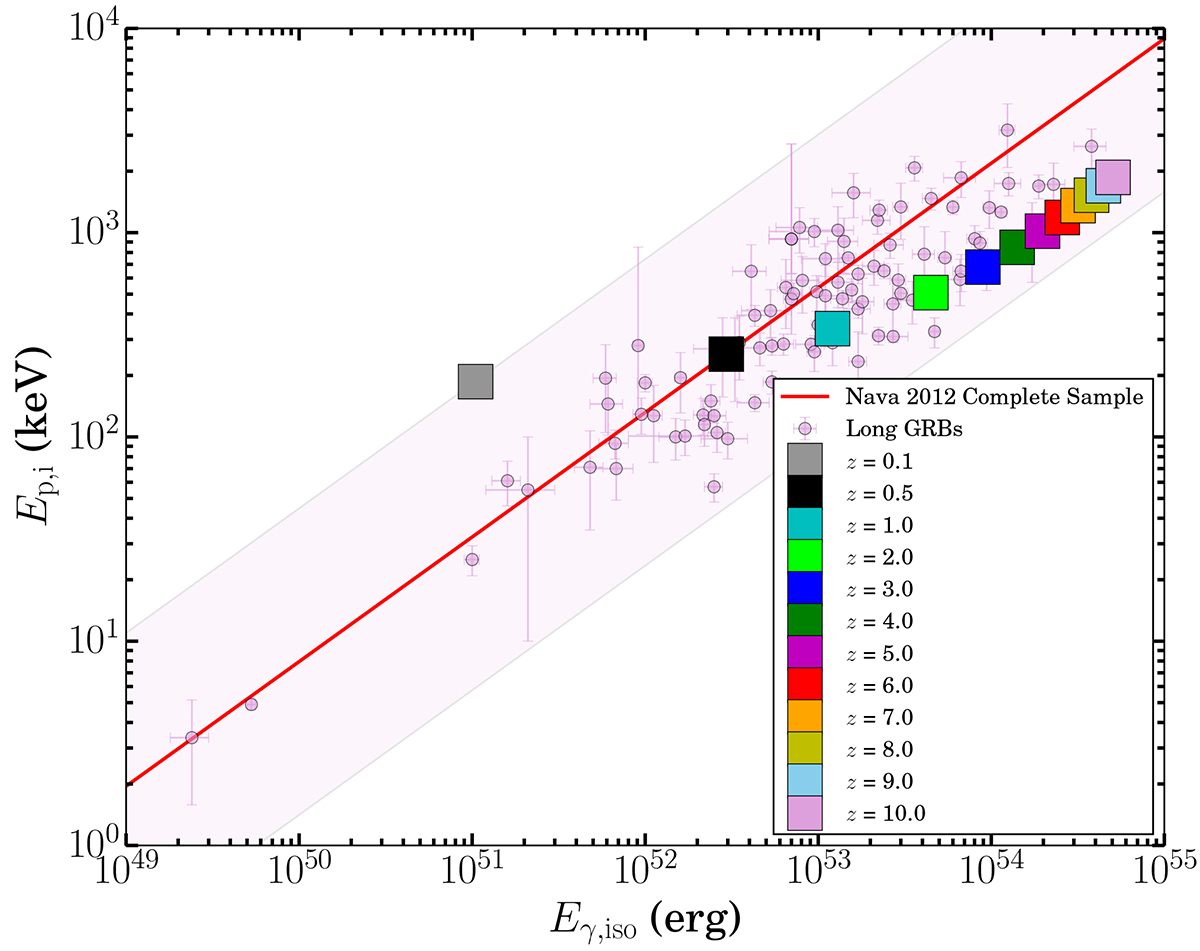
Fig. 7.
Download original image
Amati correlation for GRB 150309A. As there is no redshift measurement is available, we had to vary the redshift from 0.1 to 10. For comparison, we also show other long bursts studied by Nava et al. (2012). The solid red line shows the best-fit line, and the pink shaded band shows the associated 2-σ uncertainty using the study of a sample of long bursts by Nava et al. (2012).
Current usage metrics show cumulative count of Article Views (full-text article views including HTML views, PDF and ePub downloads, according to the available data) and Abstracts Views on Vision4Press platform.
Data correspond to usage on the plateform after 2015. The current usage metrics is available 48-96 hours after online publication and is updated daily on week days.
Initial download of the metrics may take a while.