Open Access
Fig. 6.
Download original image
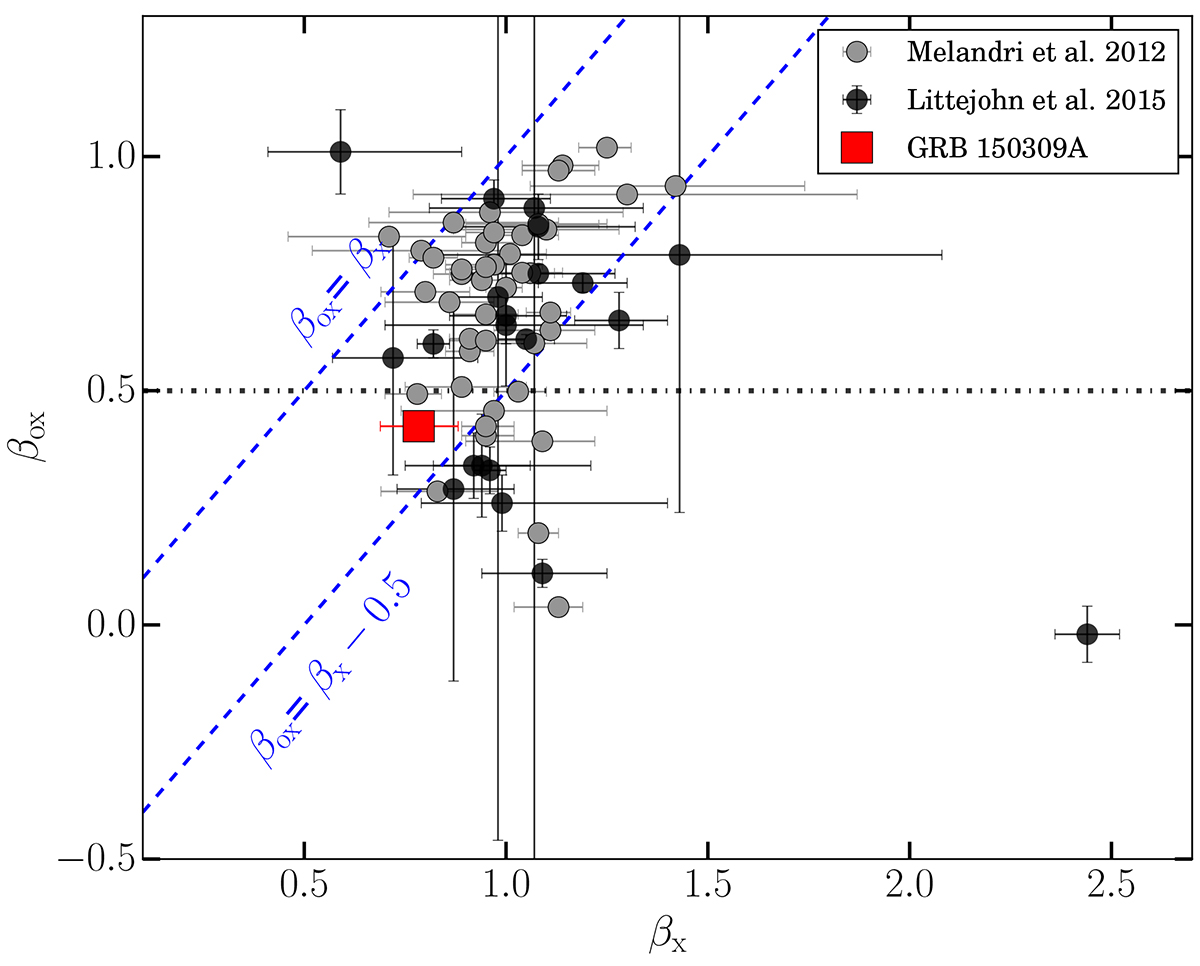
Evolution of NIR-X-ray spectral index as a function of X-ray spectral index for GRB 150309A (presented with a red square). We also show the βOX − βX data points for other well-studied samples of Swift GRBs Melandri et al. (2012), Littlejohns et al. (2015) for comparison. The horizontal dashed black line shows the βOX = 0.5.
Current usage metrics show cumulative count of Article Views (full-text article views including HTML views, PDF and ePub downloads, according to the available data) and Abstracts Views on Vision4Press platform.
Data correspond to usage on the plateform after 2015. The current usage metrics is available 48-96 hours after online publication and is updated daily on week days.
Initial download of the metrics may take a while.