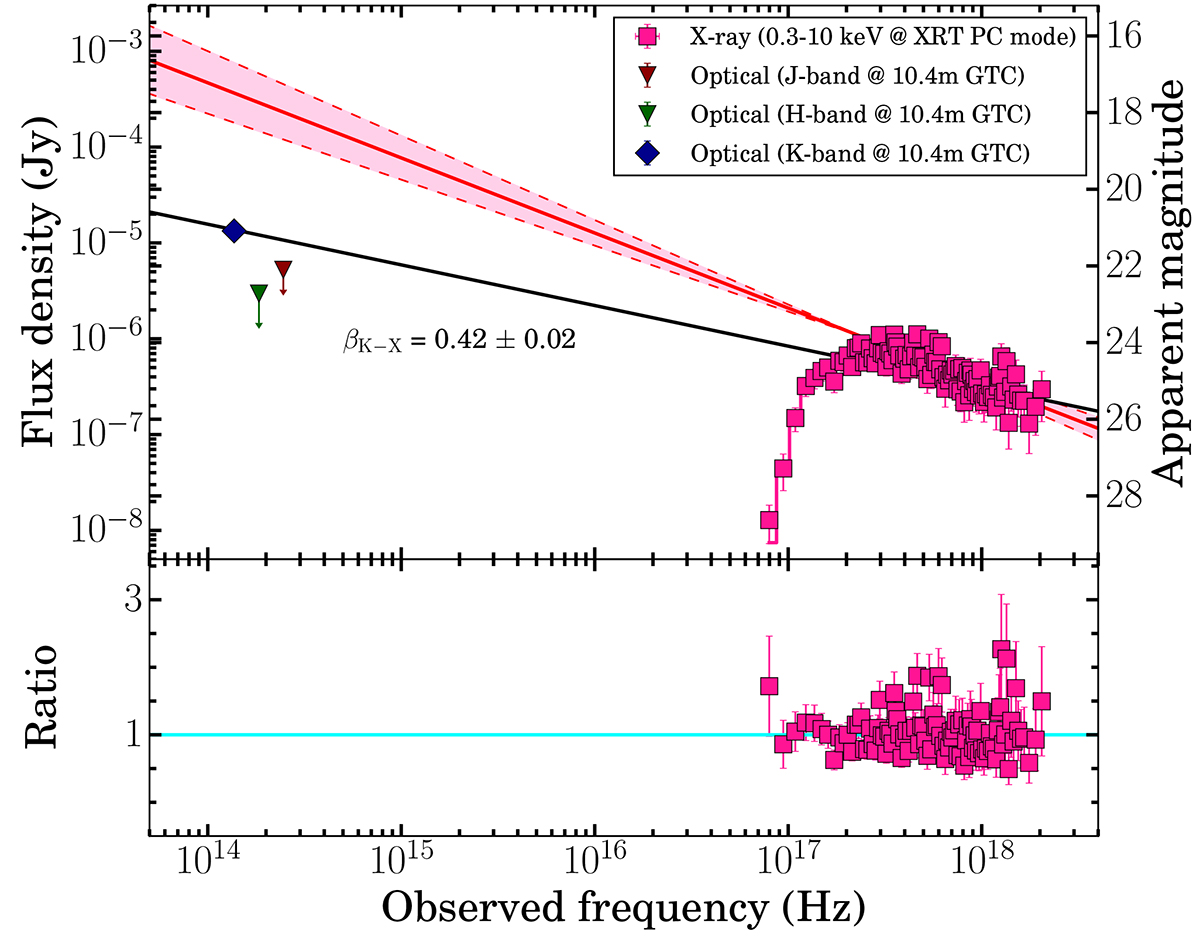
Fig. 5.
Download original image
Spectral energy distribution of GRB 150309A afterglow. Top panel: Spectral energy distribution at T0 +5.2 h using the simultaneous X-ray data as well as the NIR upper limits (and the K-band detection) reported in this paper. The solid red line indicates the X-ray spectral slop obtained using the best-fit time-averaged PC mode spectrum, and the pink shaded region within the dashed red lines indicates the associated uncertainty with the X-ray spectral slop. The solid black line indicates the joint NIR-X-ray spectral index (βK − X). The left and right sides of the Y-axis, representing the flux density and magnitude values, are in the AB system. Bottom panel: Ratio of X-ray observed data and best-fit model. The horizontal cyan line indicates the ratio equal to one.
Current usage metrics show cumulative count of Article Views (full-text article views including HTML views, PDF and ePub downloads, according to the available data) and Abstracts Views on Vision4Press platform.
Data correspond to usage on the plateform after 2015. The current usage metrics is available 48-96 hours after online publication and is updated daily on week days.
Initial download of the metrics may take a while.