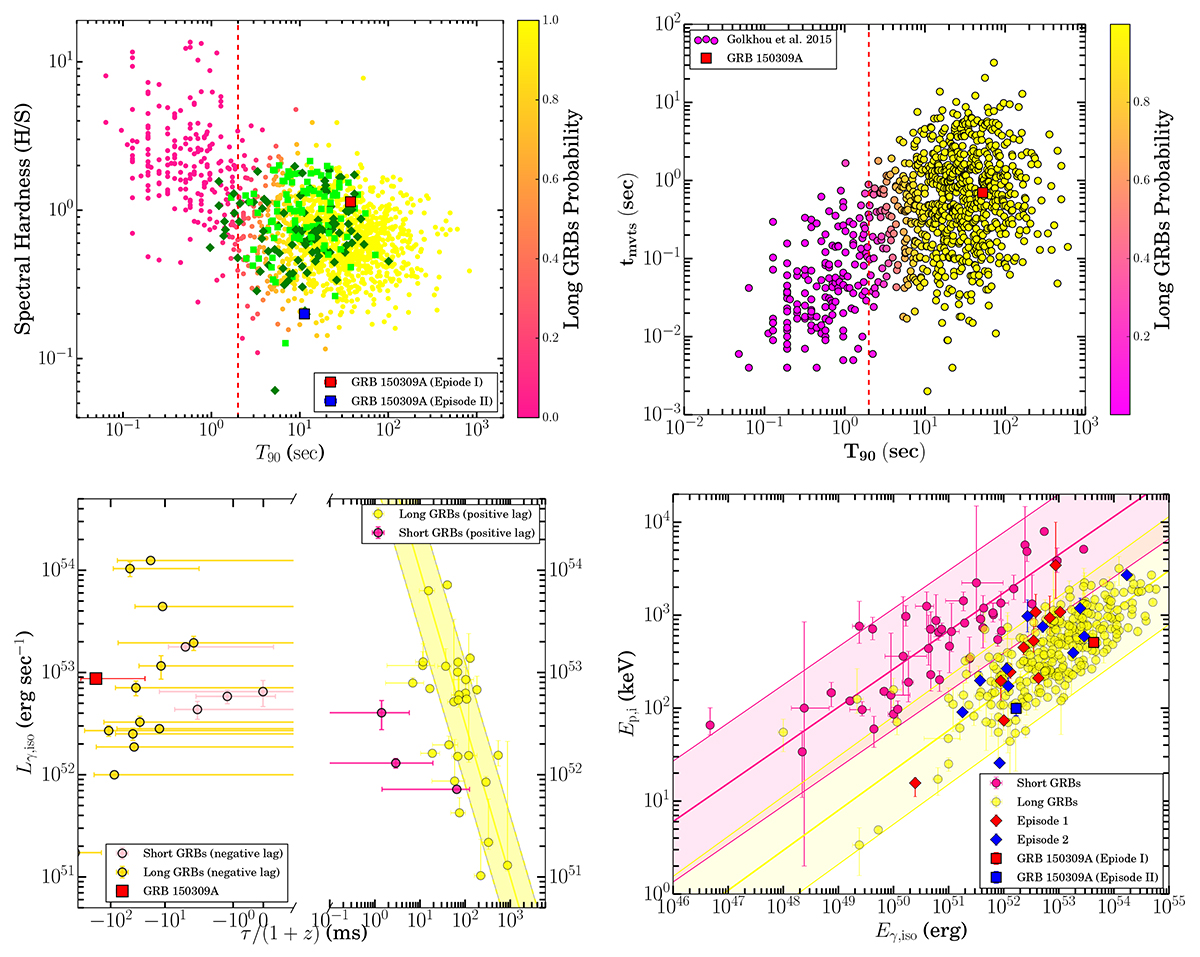
Fig. 4.
Download original image
Classification of GRB 150309A The conventional scheme of GRB classification based on the spectral hardness-duration distribution (top left), minimum variability timescale-duration distribution (top right), spectral lag-luminosity correlation (bottom left), and episode-wise Amati correlation (bottom right). The dashed lines show the boundary between long and short families of GRBs. The high-energy properties of GRB 150309A (displayed with red and blue squares) are common among long soft bursts.
Current usage metrics show cumulative count of Article Views (full-text article views including HTML views, PDF and ePub downloads, according to the available data) and Abstracts Views on Vision4Press platform.
Data correspond to usage on the plateform after 2015. The current usage metrics is available 48-96 hours after online publication and is updated daily on week days.
Initial download of the metrics may take a while.