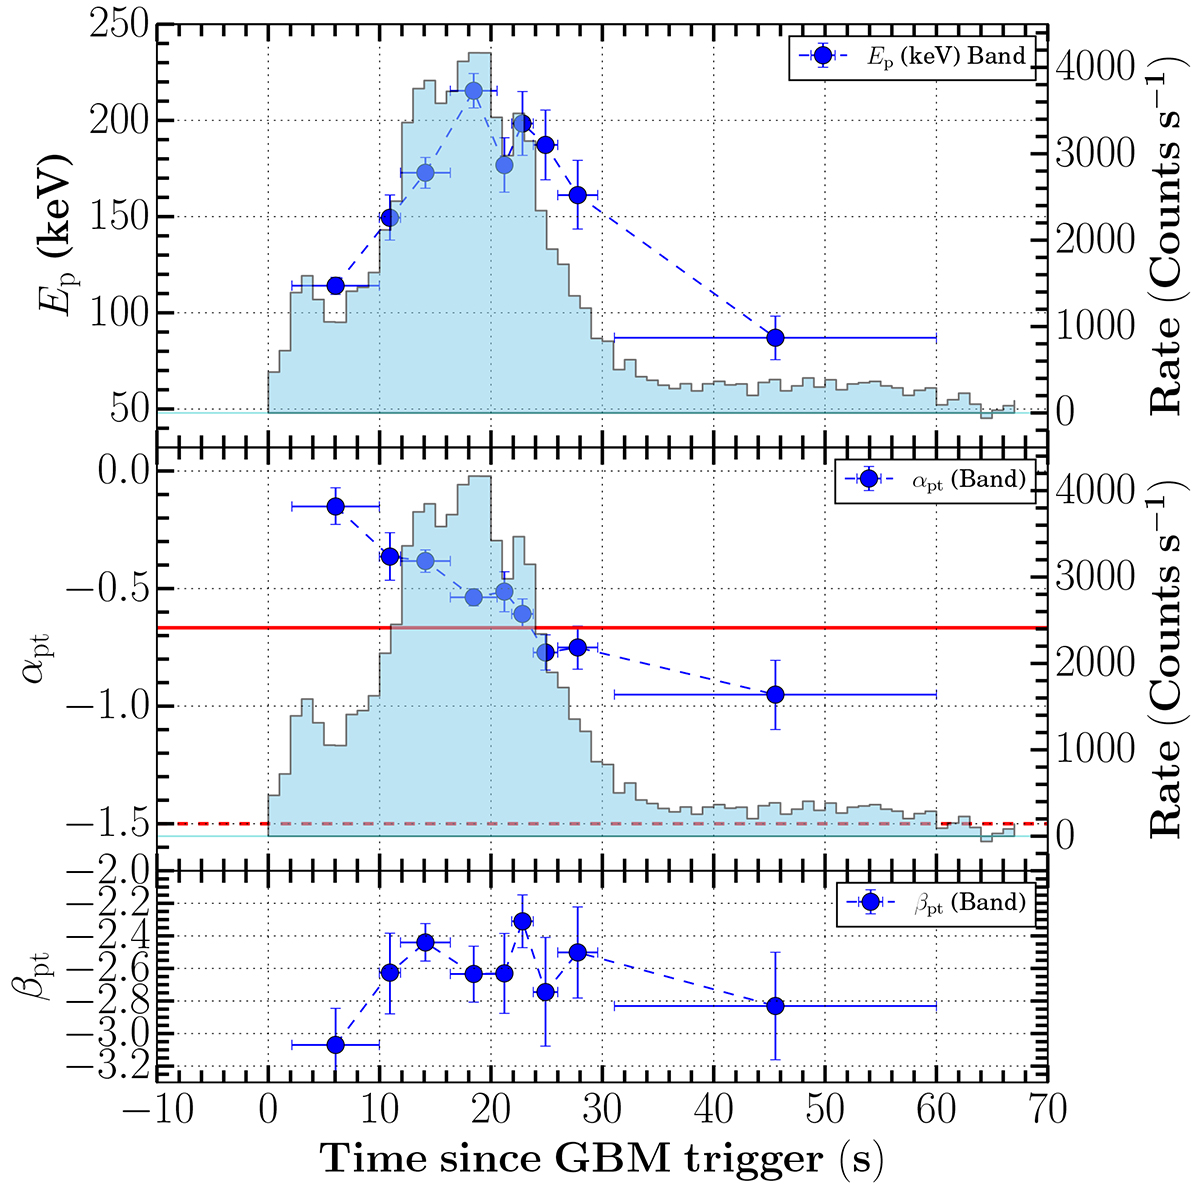
Fig. 3.
Download original image
Evolution of spectral parameters for GRB 150309A. Top panel: Peak energy evolving with time and following an intensity-tracking trend during the first episode. Middle panel: Evolution of low energy spectral index αpt using Fermi GBM data. During the first episode, αpt seems to follow a hard-to-soft trend. The two horizontal lines are lines of death for synchrotron fast cooling (αpt = −3/2, dotted dashed line) and synchrotron slow cooling (αpt = −2/3, solid red line). Bottom panel: Evolution of high-energy spectral index βpt using Fermi GBM data.
Current usage metrics show cumulative count of Article Views (full-text article views including HTML views, PDF and ePub downloads, according to the available data) and Abstracts Views on Vision4Press platform.
Data correspond to usage on the plateform after 2015. The current usage metrics is available 48-96 hours after online publication and is updated daily on week days.
Initial download of the metrics may take a while.