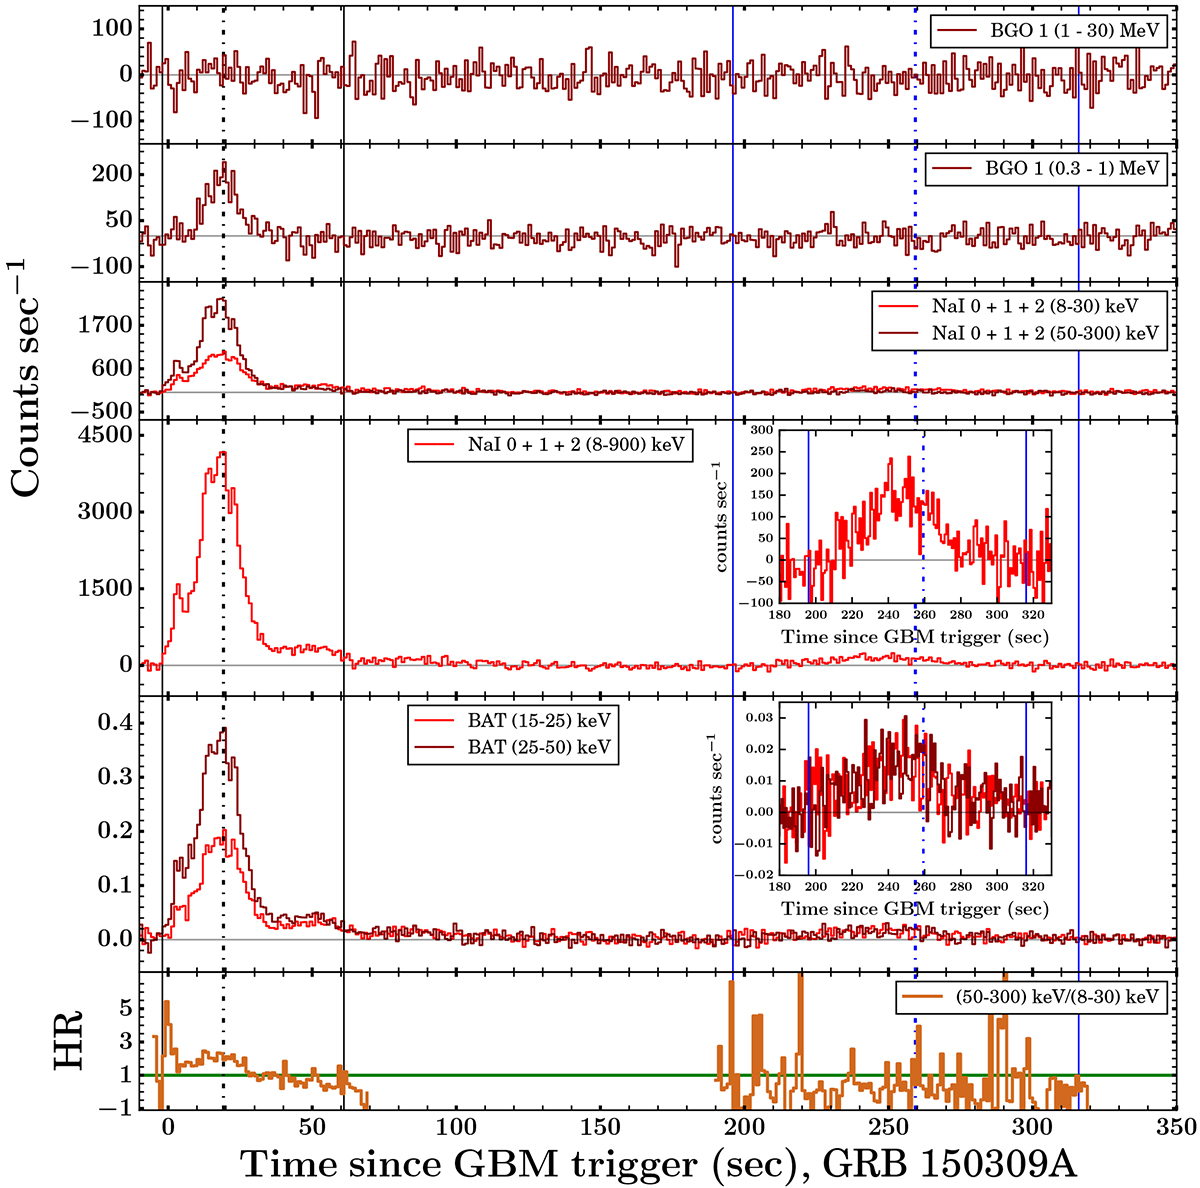
Fig. 2.
Download original image
Energy-resolved Fermi GBM and Swift BAT gamma-ray light curves of GRB 150309A: The multi-channel background-subtracted prompt emission light curve (top five panels) consists of two emission episodes with a significant temporal gap. The first and second episodes are shown with solid black and blue vertical lines, respectively. The peak times during both episodes are shown using black and blue vertical dash-dotted lines, respectively. The insets in panels four and five show a zoomed-in version of the second episode based on GBM and BAT observations. The last panel shows the evolution of the hardness ratio during both episodes. The green horizontal solid line indicates the unit value of the hardness ratio.
Current usage metrics show cumulative count of Article Views (full-text article views including HTML views, PDF and ePub downloads, according to the available data) and Abstracts Views on Vision4Press platform.
Data correspond to usage on the plateform after 2015. The current usage metrics is available 48-96 hours after online publication and is updated daily on week days.
Initial download of the metrics may take a while.