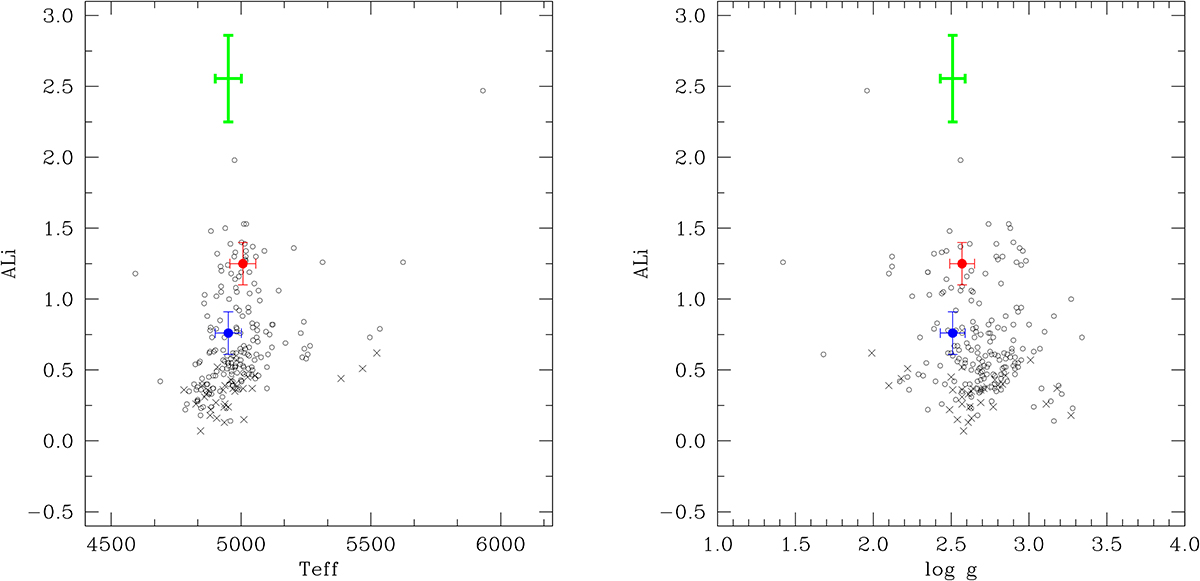
Fig. C.1.
Download original image
Li abundance derived for 378 G/K giant stars from Liu et al. (2014b) as a function of Teff and log g (left and right panels). The empty circles and crosses correspond to Li values and upper limits, respectively, measured for the 378 giant stars. The measured values in this work for stars A and B are shown in blue and red, respectively, and the predicted values after a possible planetary ingestion in star A are shown in green.
Current usage metrics show cumulative count of Article Views (full-text article views including HTML views, PDF and ePub downloads, according to the available data) and Abstracts Views on Vision4Press platform.
Data correspond to usage on the plateform after 2015. The current usage metrics is available 48-96 hours after online publication and is updated daily on week days.
Initial download of the metrics may take a while.