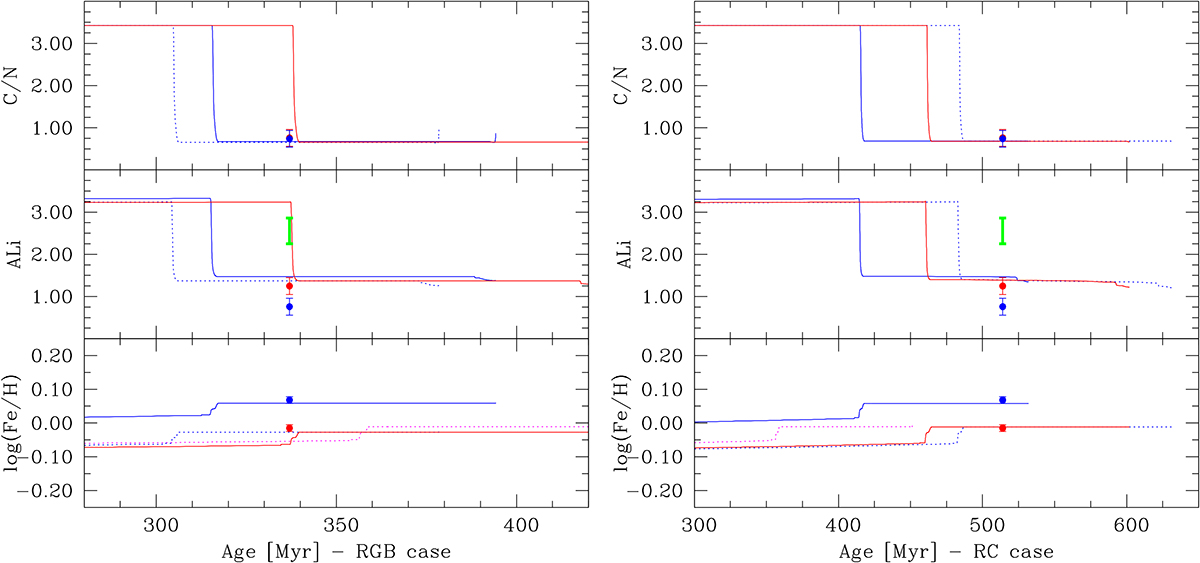
Fig. B.4.
Download original image
C/N, A(Li), and metallicity as a function of age (upper, middle, and lower panels), estimated with MIST evolutionary tracks (blue and red lines for stars A and B, respectively). The green bars show the Li content expected in star A after ingestion of planetary material. The values measured for stars A and B are shown in blue and red (including the error bars on the y-axis). The left panels correspond to the RGB phase, and the right panels correspond to the RC phase.
Current usage metrics show cumulative count of Article Views (full-text article views including HTML views, PDF and ePub downloads, according to the available data) and Abstracts Views on Vision4Press platform.
Data correspond to usage on the plateform after 2015. The current usage metrics is available 48-96 hours after online publication and is updated daily on week days.
Initial download of the metrics may take a while.