Open Access
Fig. B.3.
Download original image
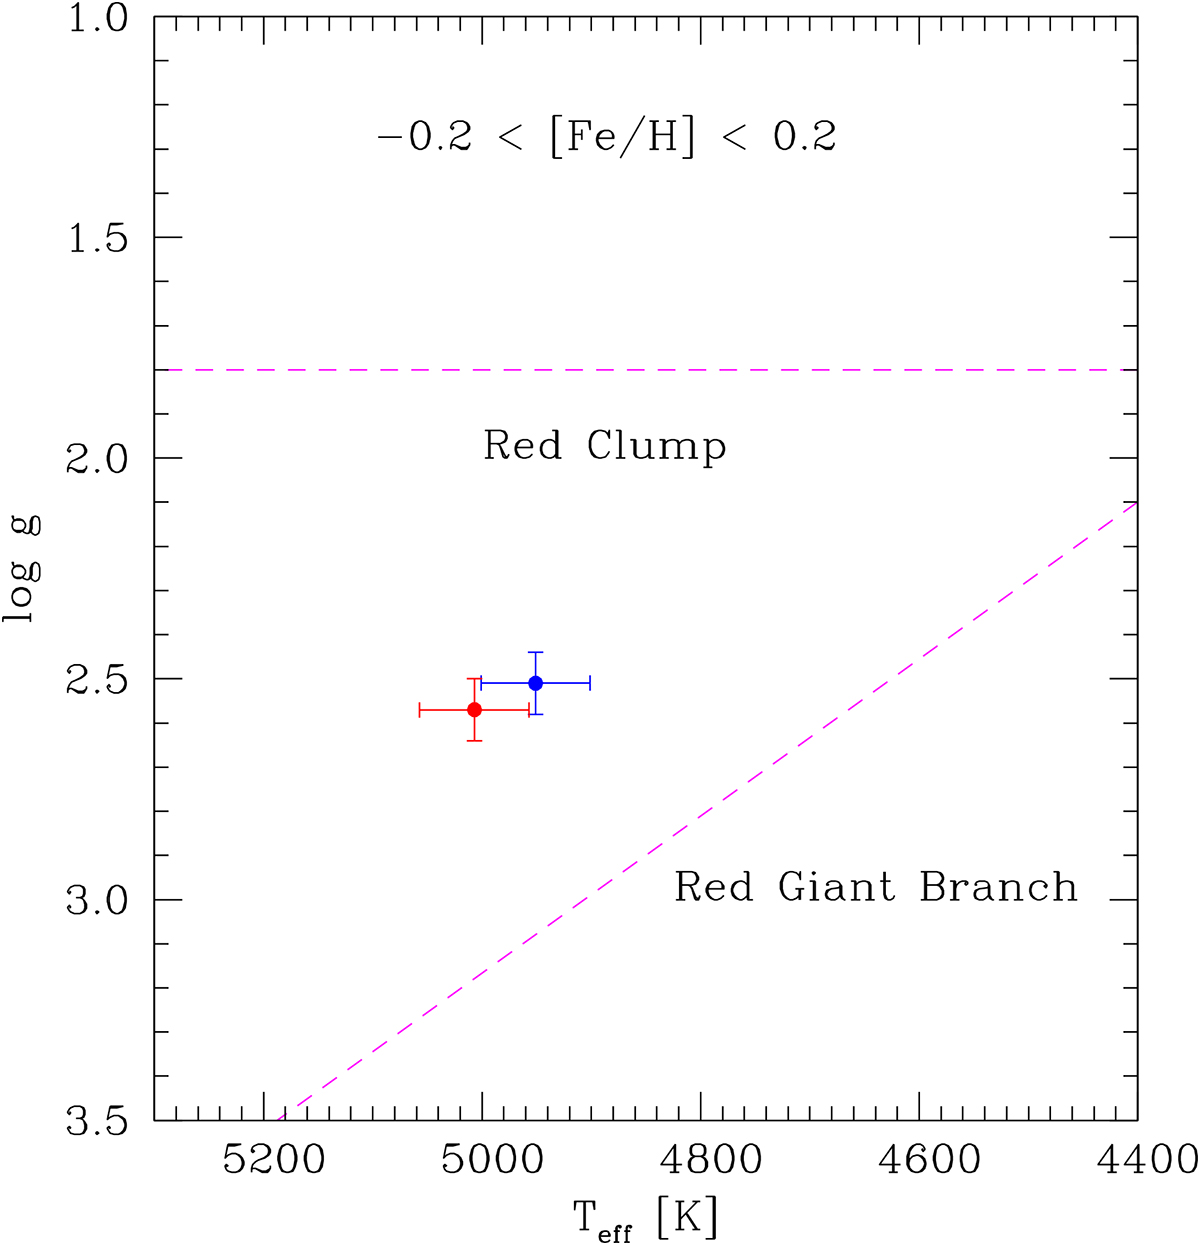
Position of stars A and B (red and blue) in the log g - Teff diagram and the cuts suggested by Bovy et al. (2014) (dashed lines) to separate the RGB and RC regions. The regions correspond to stars in the range -0.2 < [Fe/H] < 0.2.
Current usage metrics show cumulative count of Article Views (full-text article views including HTML views, PDF and ePub downloads, according to the available data) and Abstracts Views on Vision4Press platform.
Data correspond to usage on the plateform after 2015. The current usage metrics is available 48-96 hours after online publication and is updated daily on week days.
Initial download of the metrics may take a while.