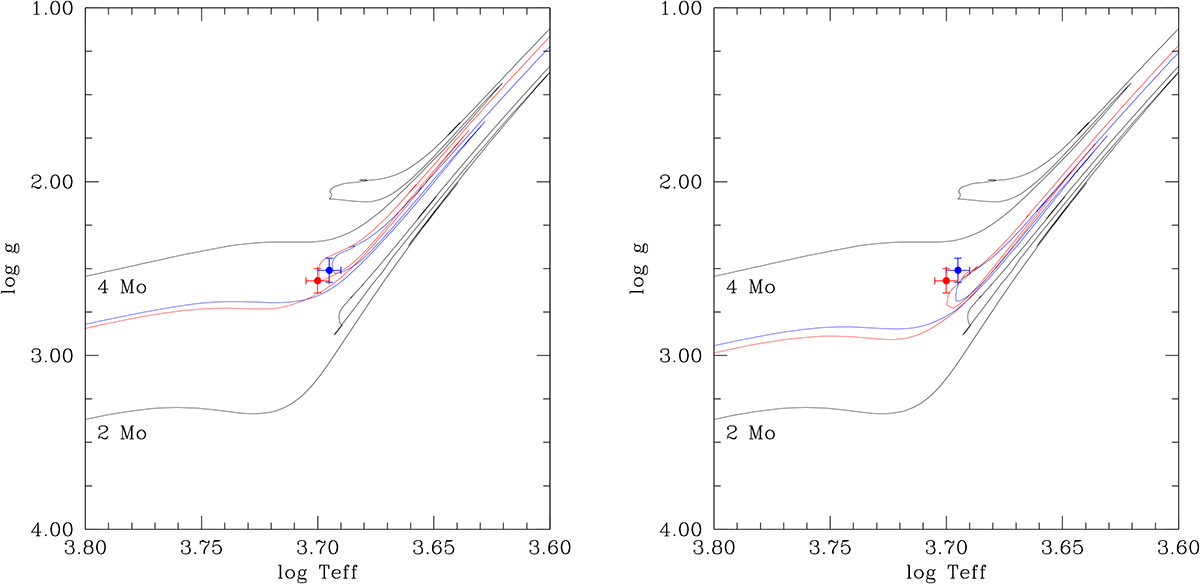
Fig. B.2.
Download original image
log Teff − log g diagram for stars A and B, and the evolutionary tracks calculated with MIST for their corresponding masses and metallicities. Blue and red correspond to stars A and B. The plot also shows two additional tracks for 2 M⊙ and 4 M⊙ (black lines) for reference. The left and right panels correspond to the RGB and RC cases, respectively.
Current usage metrics show cumulative count of Article Views (full-text article views including HTML views, PDF and ePub downloads, according to the available data) and Abstracts Views on Vision4Press platform.
Data correspond to usage on the plateform after 2015. The current usage metrics is available 48-96 hours after online publication and is updated daily on week days.
Initial download of the metrics may take a while.