Fig. 2.
Download original image
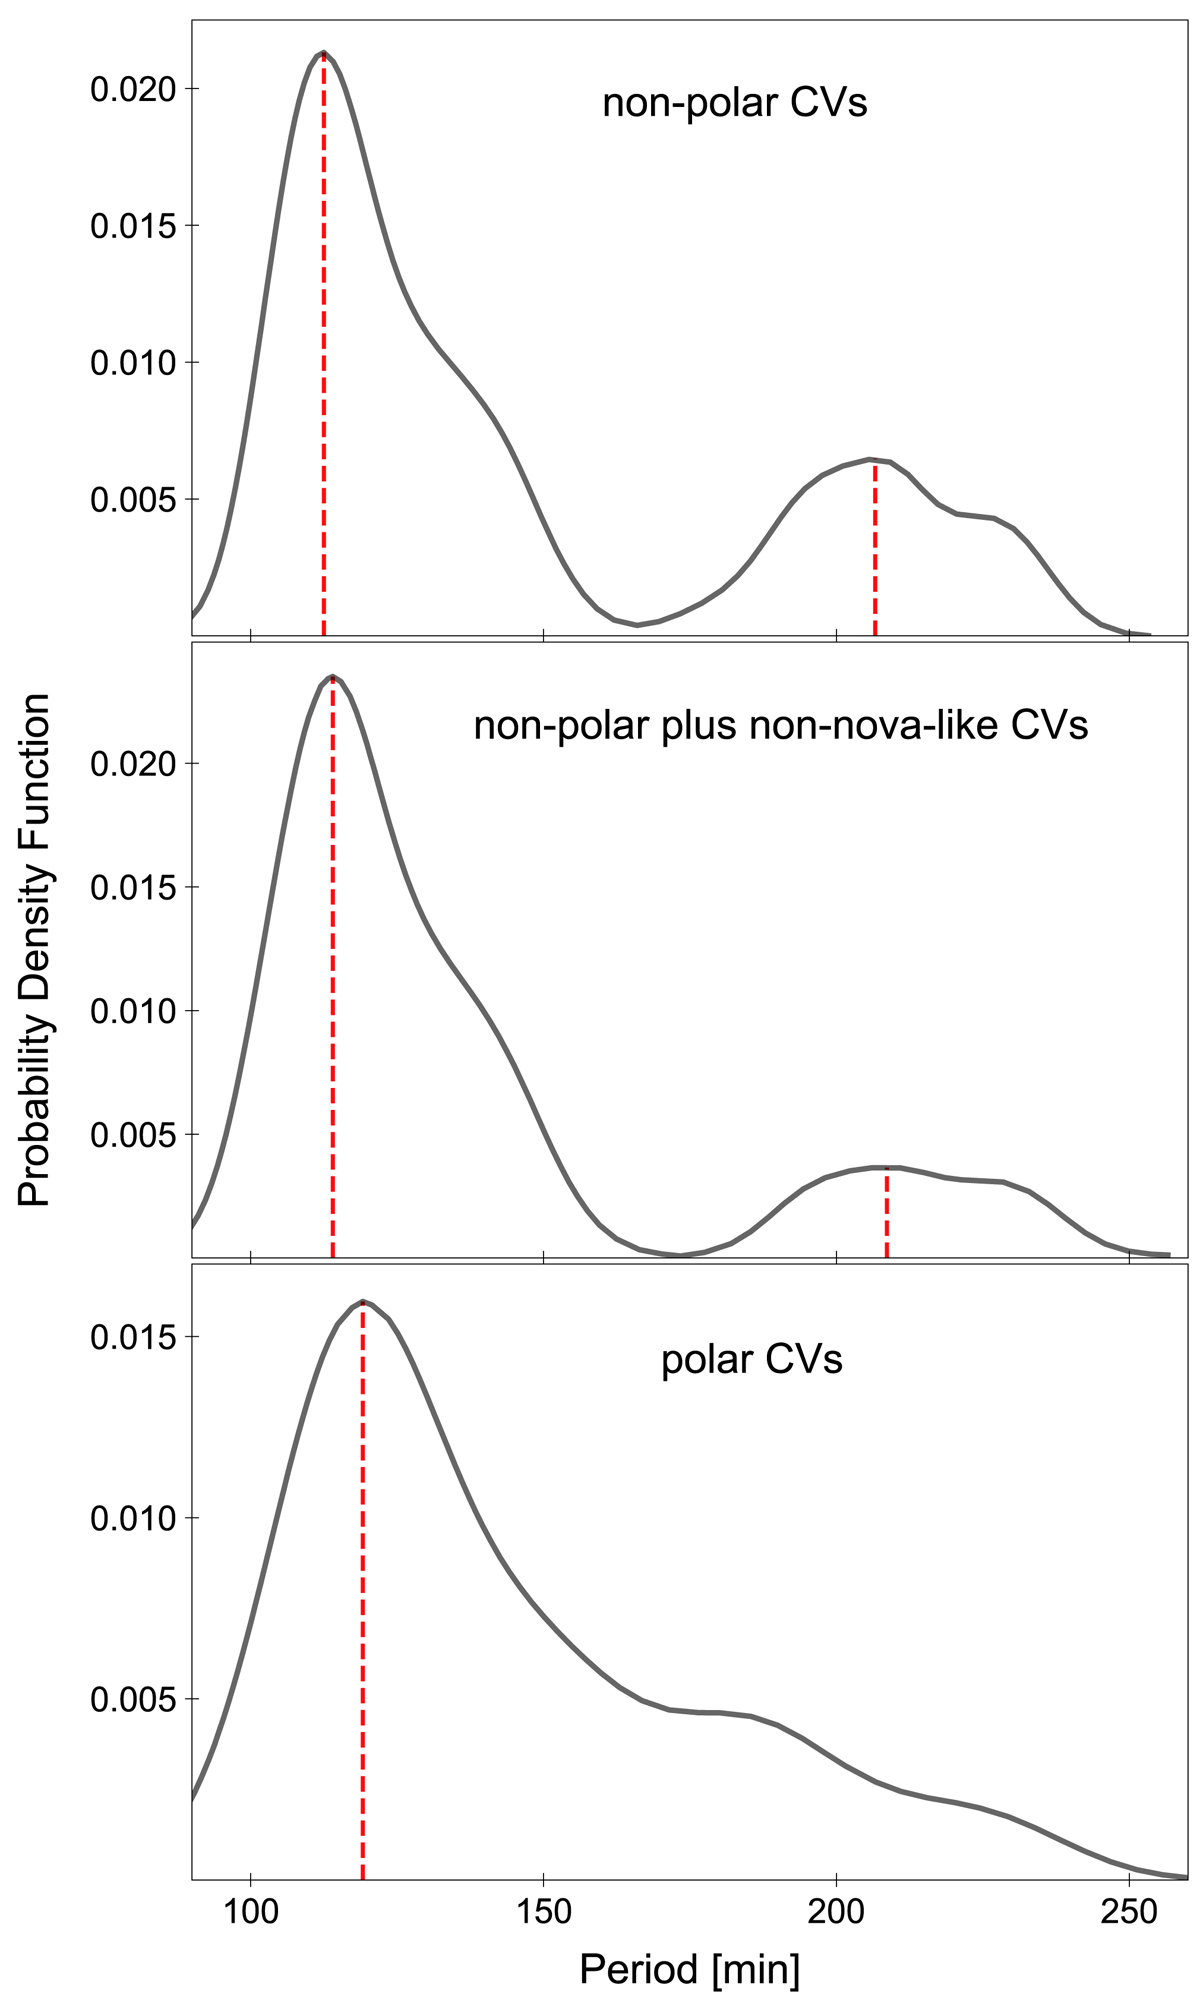
Probability density functions based on kernel density estimations with the Gaussian kernel and adopting the critical bandwidth of Silverman (1981) of the period distribution of different sub-samples of cataclysmic variables. From the top to bottom panels, we excluded the polars, the polars plus the nova likes, and finally the non-polars. The vertical dashed lines indicate the location of the modes assuming bimodal distributions (top and middle panels) and a unimodal distribution (bottom panels).
Current usage metrics show cumulative count of Article Views (full-text article views including HTML views, PDF and ePub downloads, according to the available data) and Abstracts Views on Vision4Press platform.
Data correspond to usage on the plateform after 2015. The current usage metrics is available 48-96 hours after online publication and is updated daily on week days.
Initial download of the metrics may take a while.