Fig. A.2.
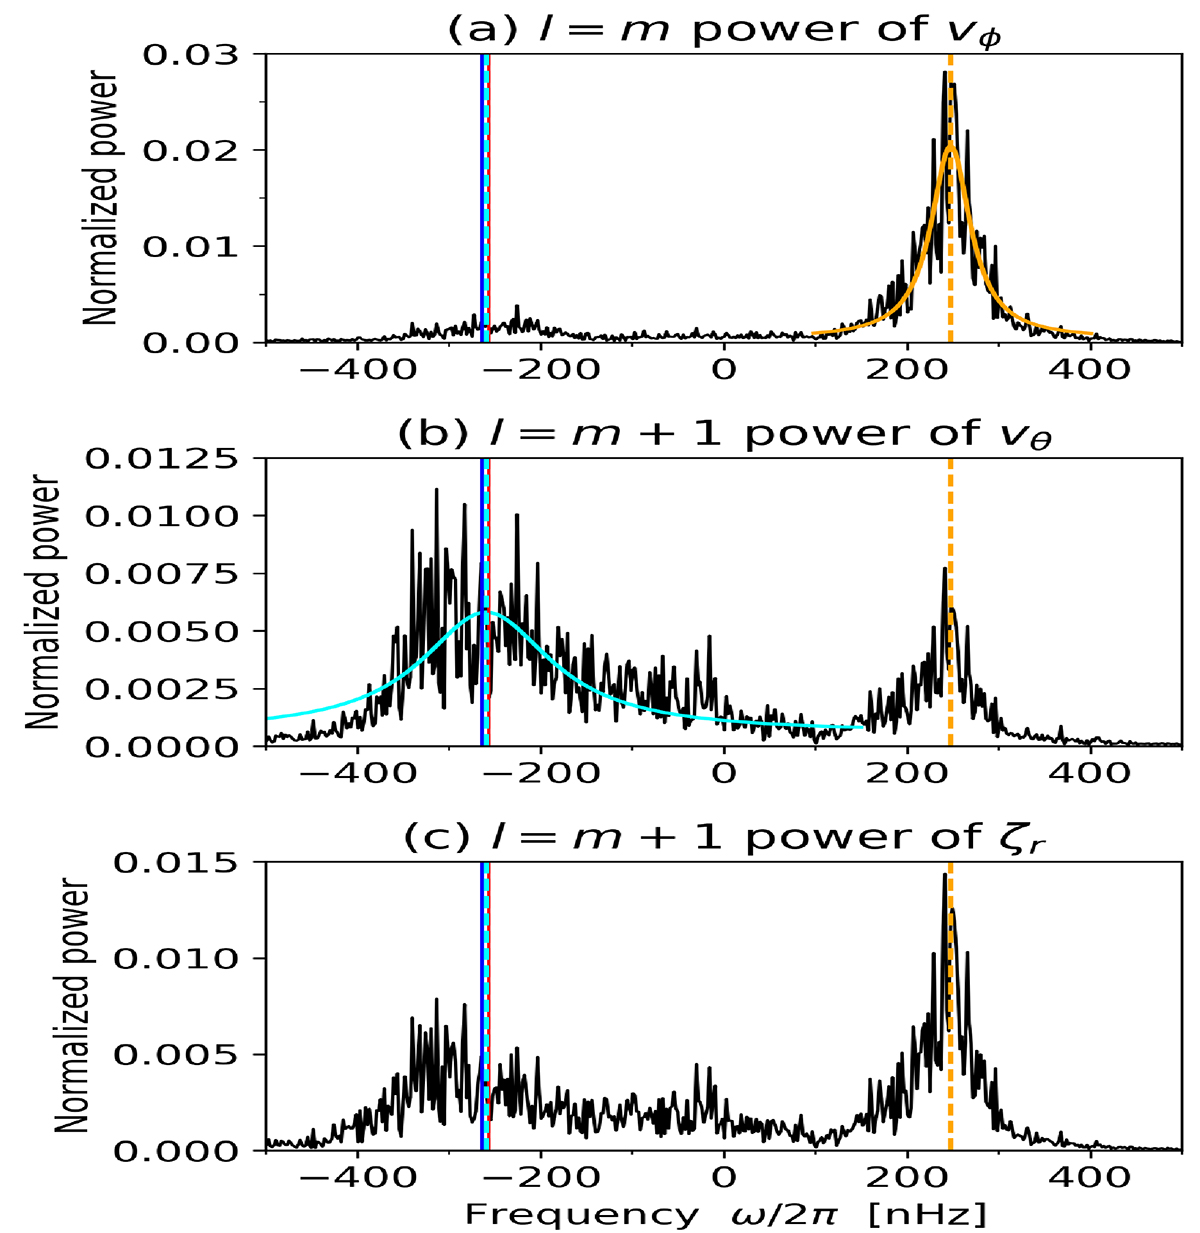
Download original image
Same power spectra as in Fig. A.1 but showing the slices at fixed azimuthal order m = 10. The red and blue solid lines denote the frequencies of the m = 10 HHS22 mode obtained from the linear calculation and measured by the observation, respectively. The cyan solid curve in panel b shows the Lorentzian fit for the spectra around the HHS22 mode power peak, and the cyan dashed line represents the fitted peak frequency. The same Lorentzian fitting is also performed for the columnar convective mode in panel (a) and shown by orange solid curve and dashed line.
Current usage metrics show cumulative count of Article Views (full-text article views including HTML views, PDF and ePub downloads, according to the available data) and Abstracts Views on Vision4Press platform.
Data correspond to usage on the plateform after 2015. The current usage metrics is available 48-96 hours after online publication and is updated daily on week days.
Initial download of the metrics may take a while.