Fig. 6.
Download original image
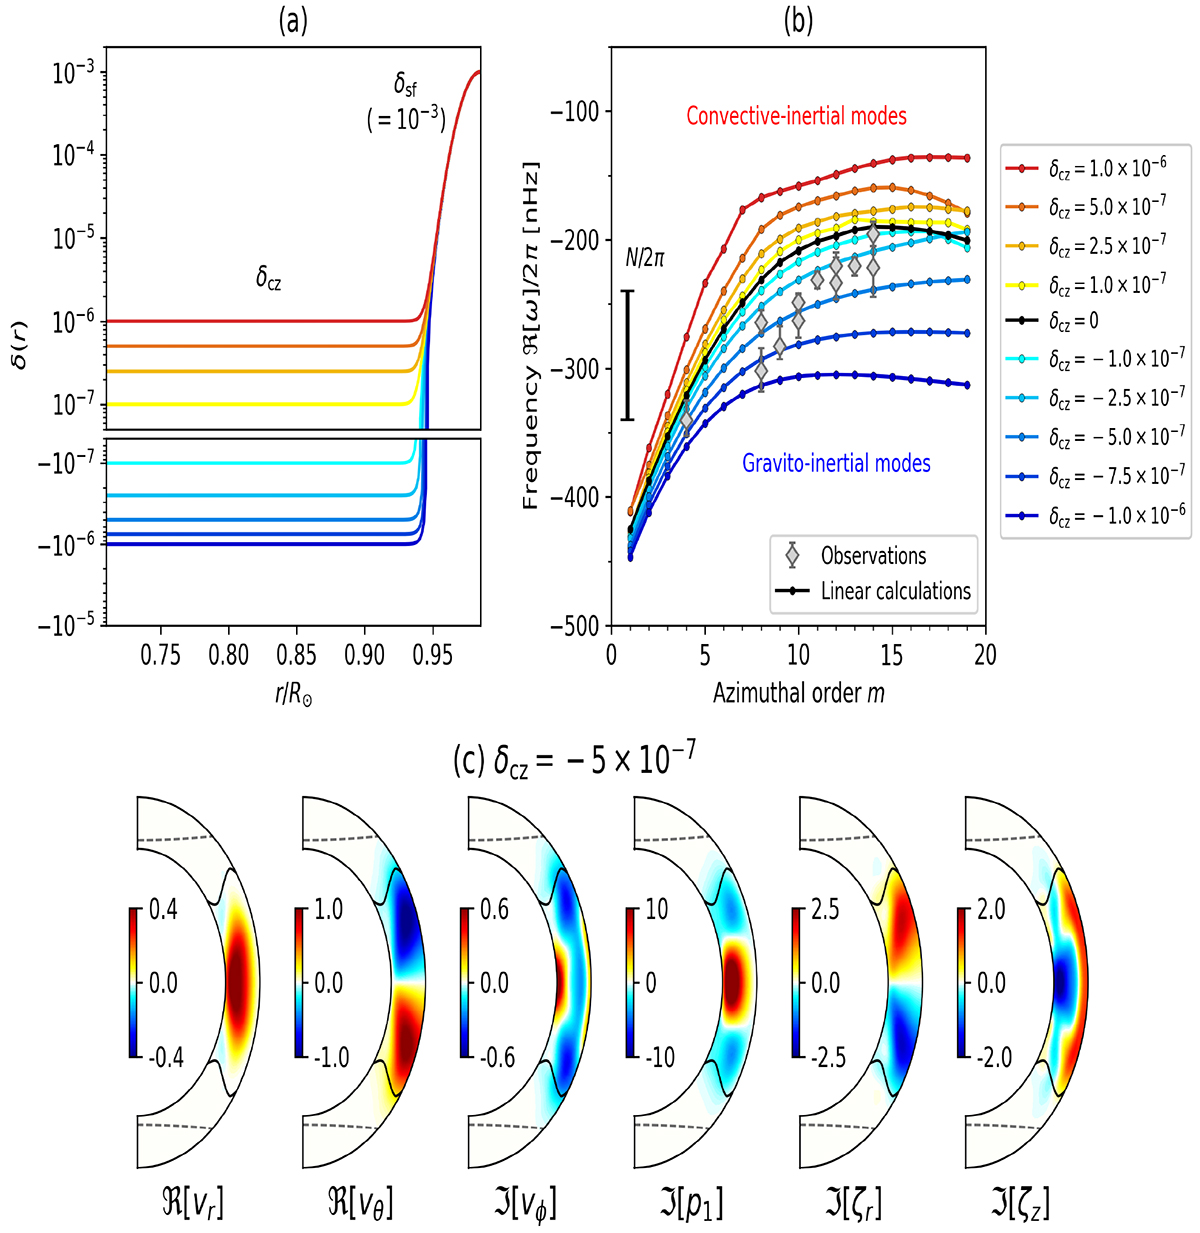
(a) Radial profiles of the superadiabaticity δ(r) defined by Eq. (2) for different values of the bulk superadiabaticity δcz. The superadiabaticity in the near-surface layer is fixed to δsf = 10−3. (b) Dispersion relations of the HHS22 modes computed for different superadiabaticity profiles. The observed frequencies reported by hanson2022 are denoted by gray diamonds. (c) Meridional eigenfunctions from the case with weakly subadiabatic bulk convection zone (δcz = −5 × 10⁻⁷). Black solid and gray dashed curves show the locations of the critical latitudes (by differential rotation) and the turning surfaces (by subadiabatic stratification), respectively.
Current usage metrics show cumulative count of Article Views (full-text article views including HTML views, PDF and ePub downloads, according to the available data) and Abstracts Views on Vision4Press platform.
Data correspond to usage on the plateform after 2015. The current usage metrics is available 48-96 hours after online publication and is updated daily on week days.
Initial download of the metrics may take a while.