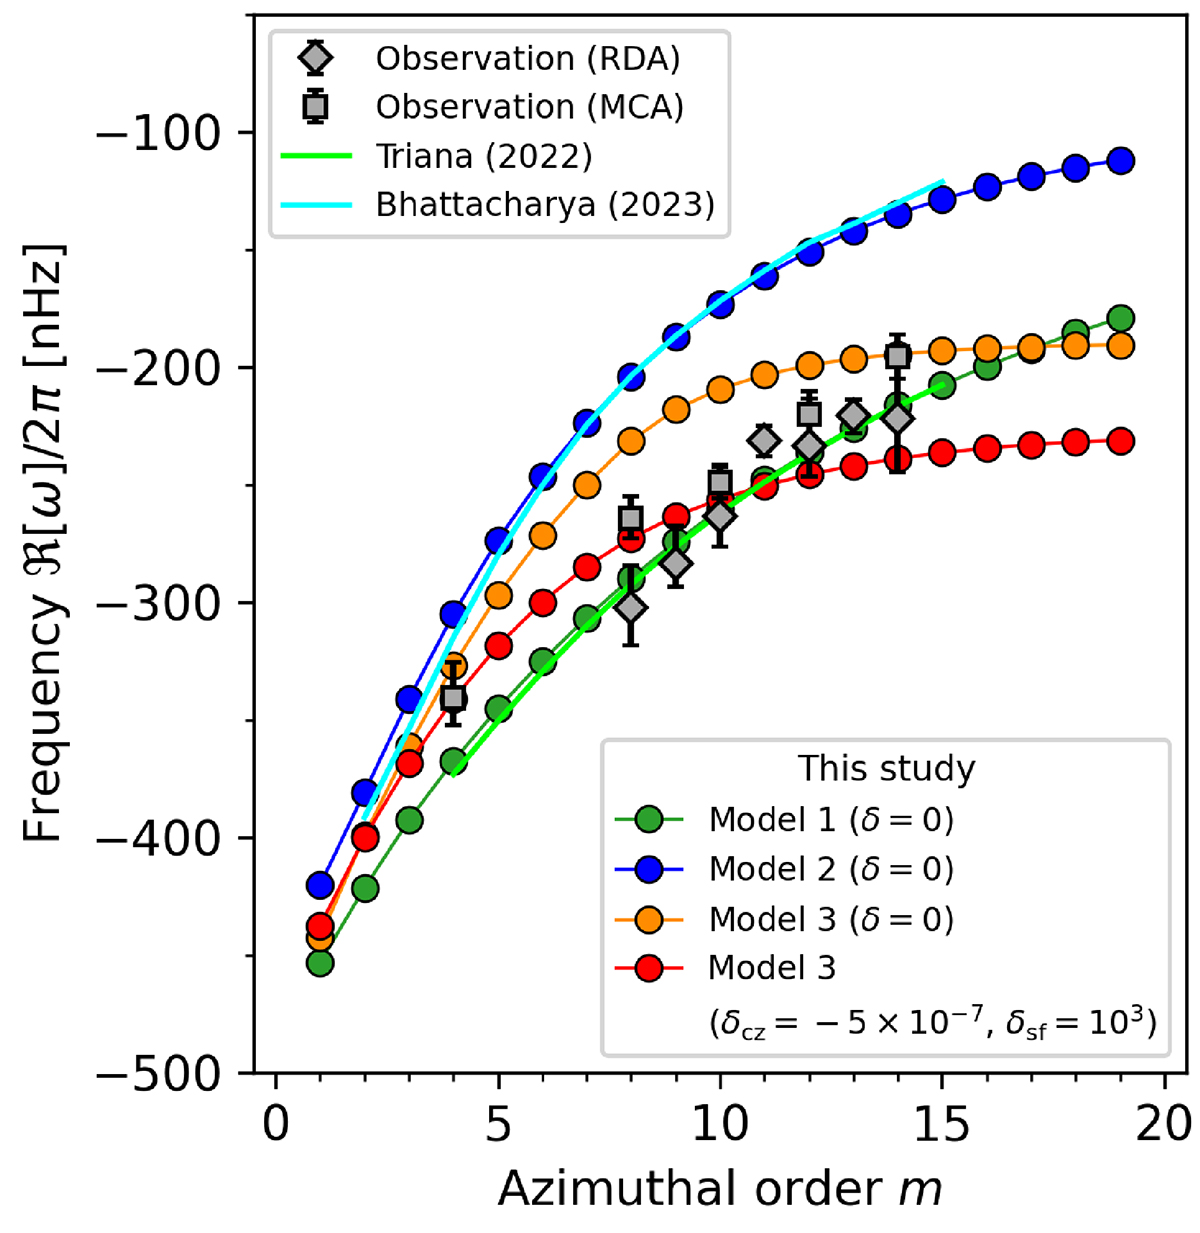
Fig. 1.
Download original image
Dispersion relation of the HHS22 modes obtained from the linear analysis for 1 ≤ m ≤ 19. Green points represent the results from our model 1 where we assume an incompressible (constant density) fluid and an uniform rotation. Blue points represent the results from our model 2 where the solar density stratification is included but the uniform rotation is still assumed. Orange points represent the results from our model 3 where both the density stratification and the differential rotation of the Sun are included. Red points also show the results from model 3 but with a weakly subadiabatic bulk convection zone (δcz = −5 × 10⁻⁷) and a strongly superadiabatic near-surface layer (δsf = 10−3). Lime and cyan solid curves show the results from triana2022 and from bhattacharya2022, respectively. For comparison, we also show the observed frequencies of the HHS22 modes reported in hanson2022 where the gray diamonds and squares denote the measurements with ring-diagram analysis (RDA) and mode-coupling analysis (MCA), respectively. All the frequencies are measured in the Carrington frame rotating at Ω0/2π = 456 nHz.
Current usage metrics show cumulative count of Article Views (full-text article views including HTML views, PDF and ePub downloads, according to the available data) and Abstracts Views on Vision4Press platform.
Data correspond to usage on the plateform after 2015. The current usage metrics is available 48-96 hours after online publication and is updated daily on week days.
Initial download of the metrics may take a while.