Fig. 22.
Download original image
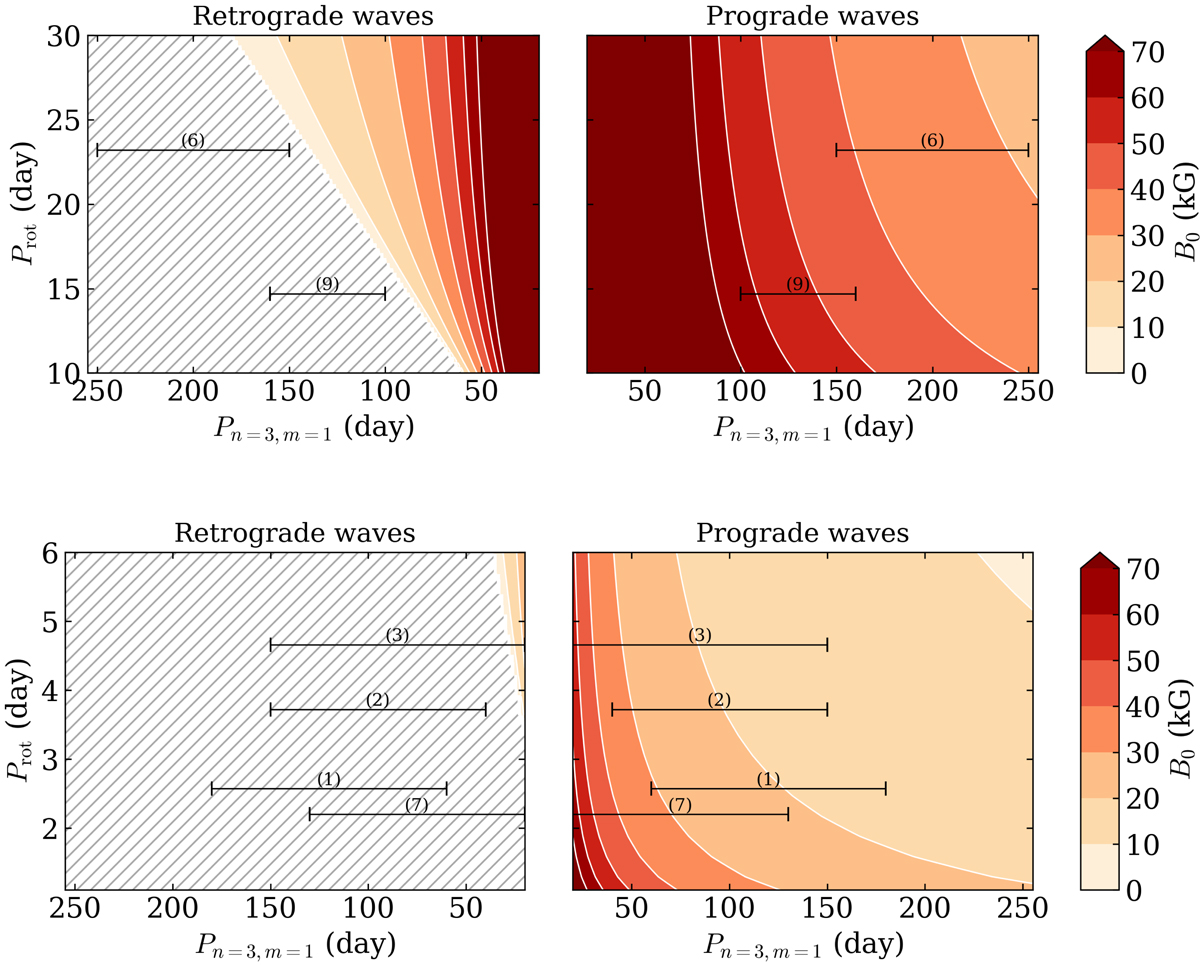
B0 field intensity computed for a n = 3, m = 1 magneto-Rossby wave in a given range of rotation period Prot and wave periods Pnm = 2π/ωnm, for ρ = 1 × 10⁻¹ g cm−1, Rtach = 0.7 R⊙ (top) and ρ = 1 × 10⁻³ g cm−1, Rtach = 0.9 R⋆, R⋆ = 1.5 R⊙ (bottom). Retrograde waves are shown in the left panel, and prograde waves are plotted in the right panel. The location of the six stars with significant spot coverage modulations is shown in black in the diagram. Each star is identified with the identifier provided in Table 1. See the main text for the explanation of the range of Prot shown in each panel.
Current usage metrics show cumulative count of Article Views (full-text article views including HTML views, PDF and ePub downloads, according to the available data) and Abstracts Views on Vision4Press platform.
Data correspond to usage on the plateform after 2015. The current usage metrics is available 48-96 hours after online publication and is updated daily on week days.
Initial download of the metrics may take a while.