Fig. 2.
Download original image
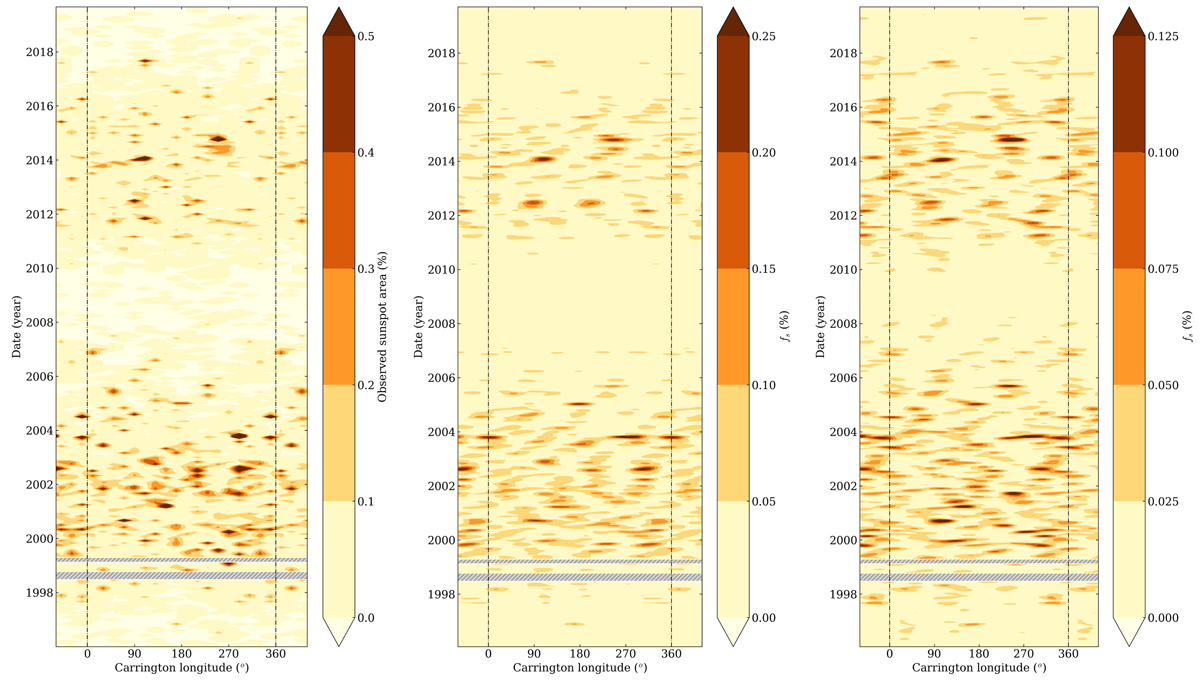
Observed longitudinal sunspot distribution (left) and longitudinal spot distribution obtained from the analysis of the VIRGO/SPM solar time series for the spots-and-faculae model (middle) and the spots-only model (right) during cycles 23 and 24. The longitudinal map is extended at each edge to reflect the periodic nature of the distributions. In all three panels, the grey hatched areas highlight the time interval for which VIRGO/SPM observations are lacking.
Current usage metrics show cumulative count of Article Views (full-text article views including HTML views, PDF and ePub downloads, according to the available data) and Abstracts Views on Vision4Press platform.
Data correspond to usage on the plateform after 2015. The current usage metrics is available 48-96 hours after online publication and is updated daily on week days.
Initial download of the metrics may take a while.