Fig. 15.
Download original image
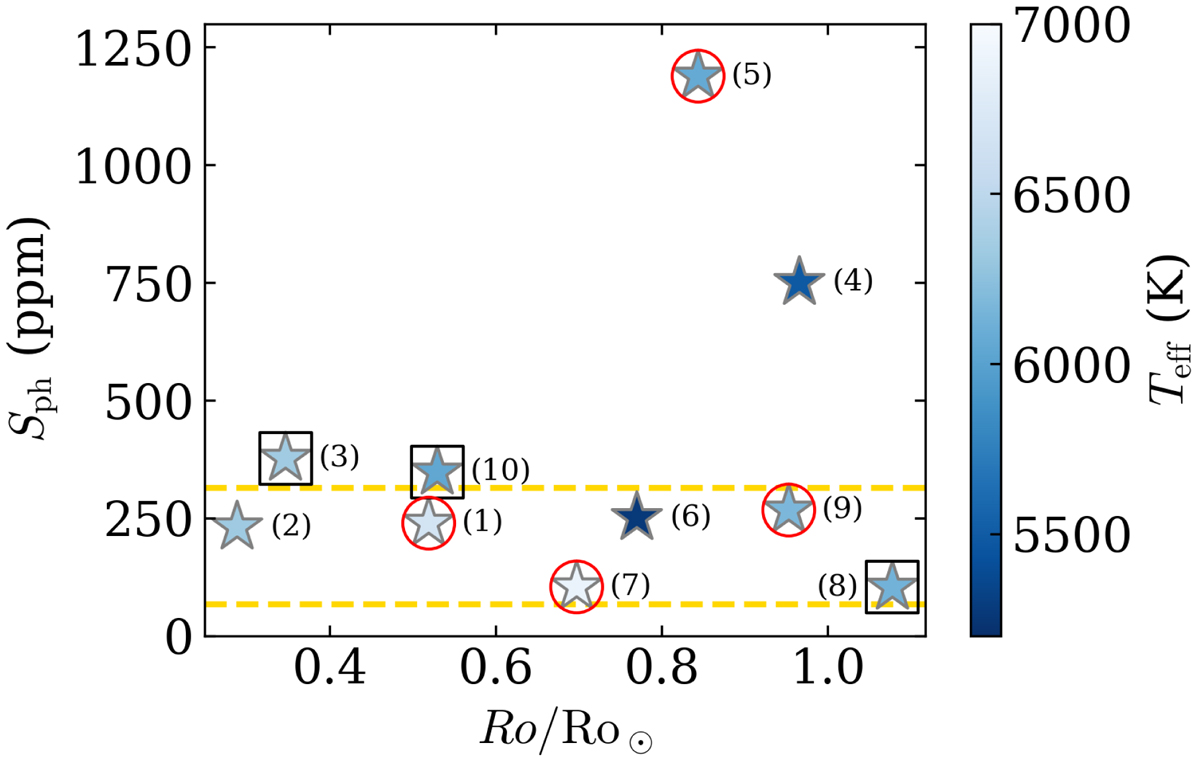
Ro/Ro⊙ vs. Sph diagram for the Kepler stars in our sample. The effective temperature, Teff, is color-coded. The stars for which we have a clear detection of longitudinal active nests are highlighted with red circles, and the stars with a possible signature are highlighted with black squares. The minimum and maximum Sph values computed by Salabert et al. (2016b) for the Sun are shown by horizontal dashed yellow lines. The star identifiers of the figure correspond to those given in Table 1.
Current usage metrics show cumulative count of Article Views (full-text article views including HTML views, PDF and ePub downloads, according to the available data) and Abstracts Views on Vision4Press platform.
Data correspond to usage on the plateform after 2015. The current usage metrics is available 48-96 hours after online publication and is updated daily on week days.
Initial download of the metrics may take a while.