Fig. 1.
Download original image
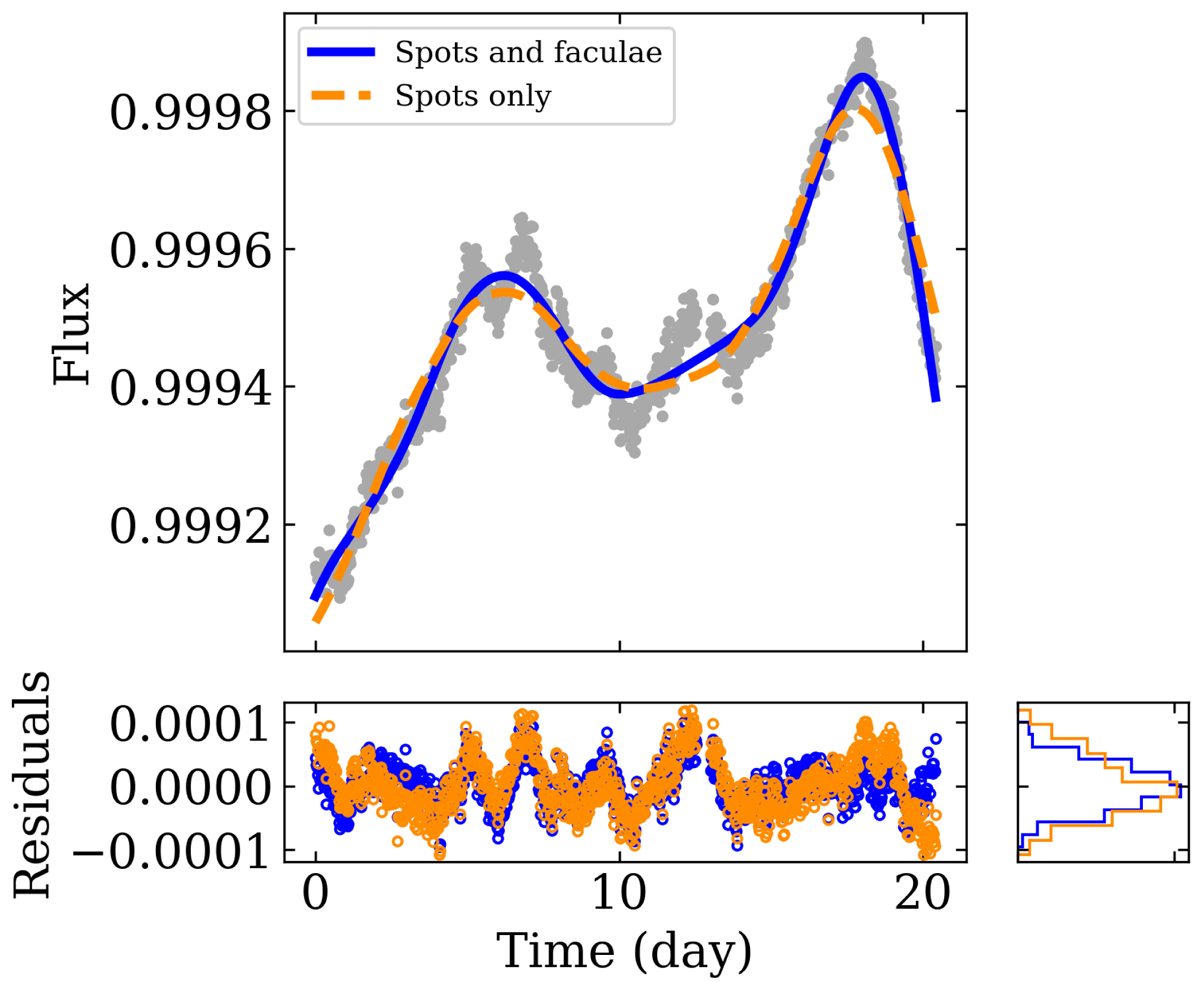
Example of VIRGO/SPM observations compared with the spot models. Top: Best-fit model obtained with the spots-and-faculae model (blue) and the spots-only model (dashed orange) for the VIRGO/SPM segment spanning from 13 April 2002 to 11 May 2002 (grey dots). Bottom: Best-fit residuals for the spots-and-faculae model (blue dots) and the spots-only model (orange dots). The histogram distribution of the residuals is shown on the right in the corresponding colours.
Current usage metrics show cumulative count of Article Views (full-text article views including HTML views, PDF and ePub downloads, according to the available data) and Abstracts Views on Vision4Press platform.
Data correspond to usage on the plateform after 2015. The current usage metrics is available 48-96 hours after online publication and is updated daily on week days.
Initial download of the metrics may take a while.