Fig. 14
Download original image
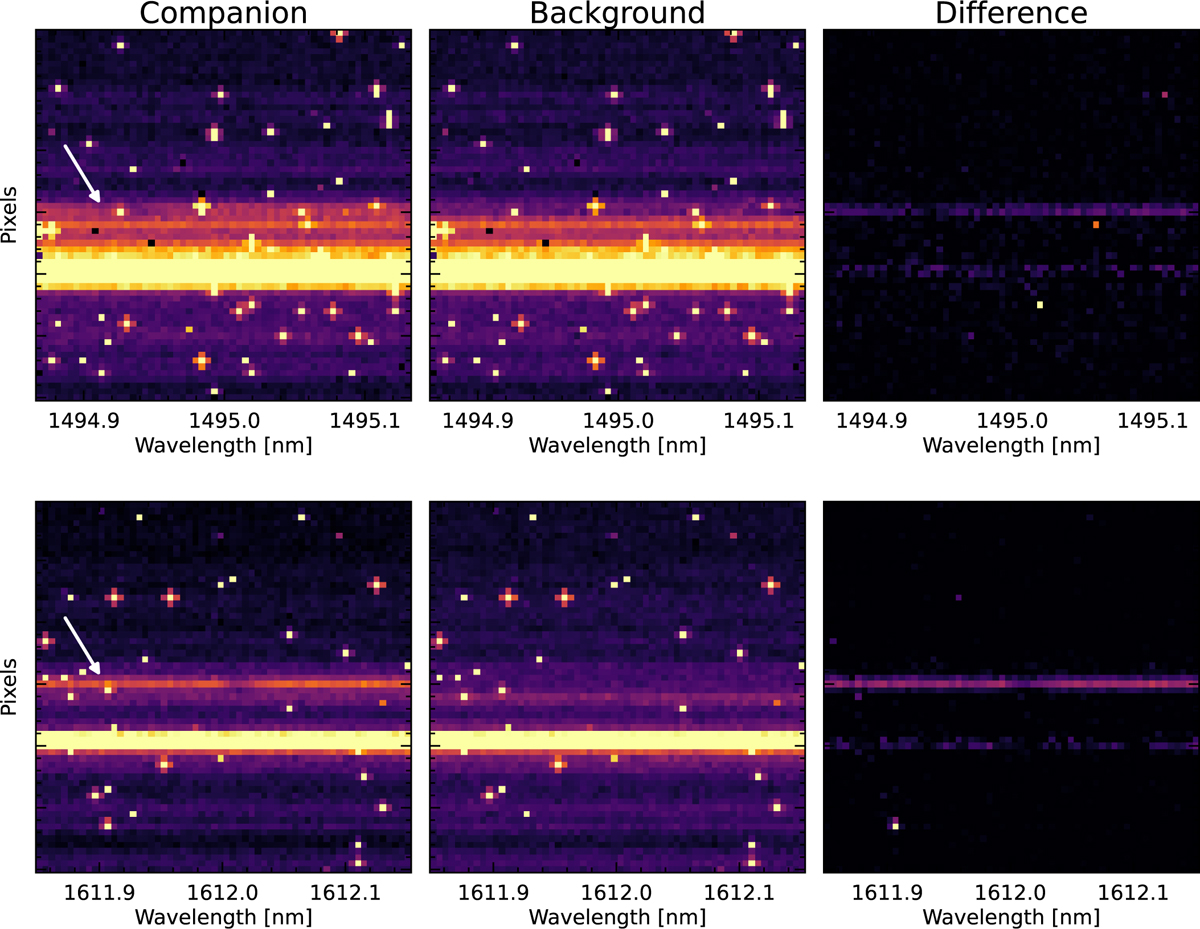
Examples of AO guide fiber leakage into the slit and its impact on science data. Order #2, detector #3 at the top, and order #5, detector #2 at the bottom. The color scale and normalization are the same for all images, and the bad pixels have not been corrected. In this example, the companion has a visual magnitude of H = 12.6 and the images are the sum of two DITs of 600 s. The position of the companion’s signal in the raw data is identified with a white arrow.
Current usage metrics show cumulative count of Article Views (full-text article views including HTML views, PDF and ePub downloads, according to the available data) and Abstracts Views on Vision4Press platform.
Data correspond to usage on the plateform after 2015. The current usage metrics is available 48-96 hours after online publication and is updated daily on week days.
Initial download of the metrics may take a while.