Fig. 7
Download original image
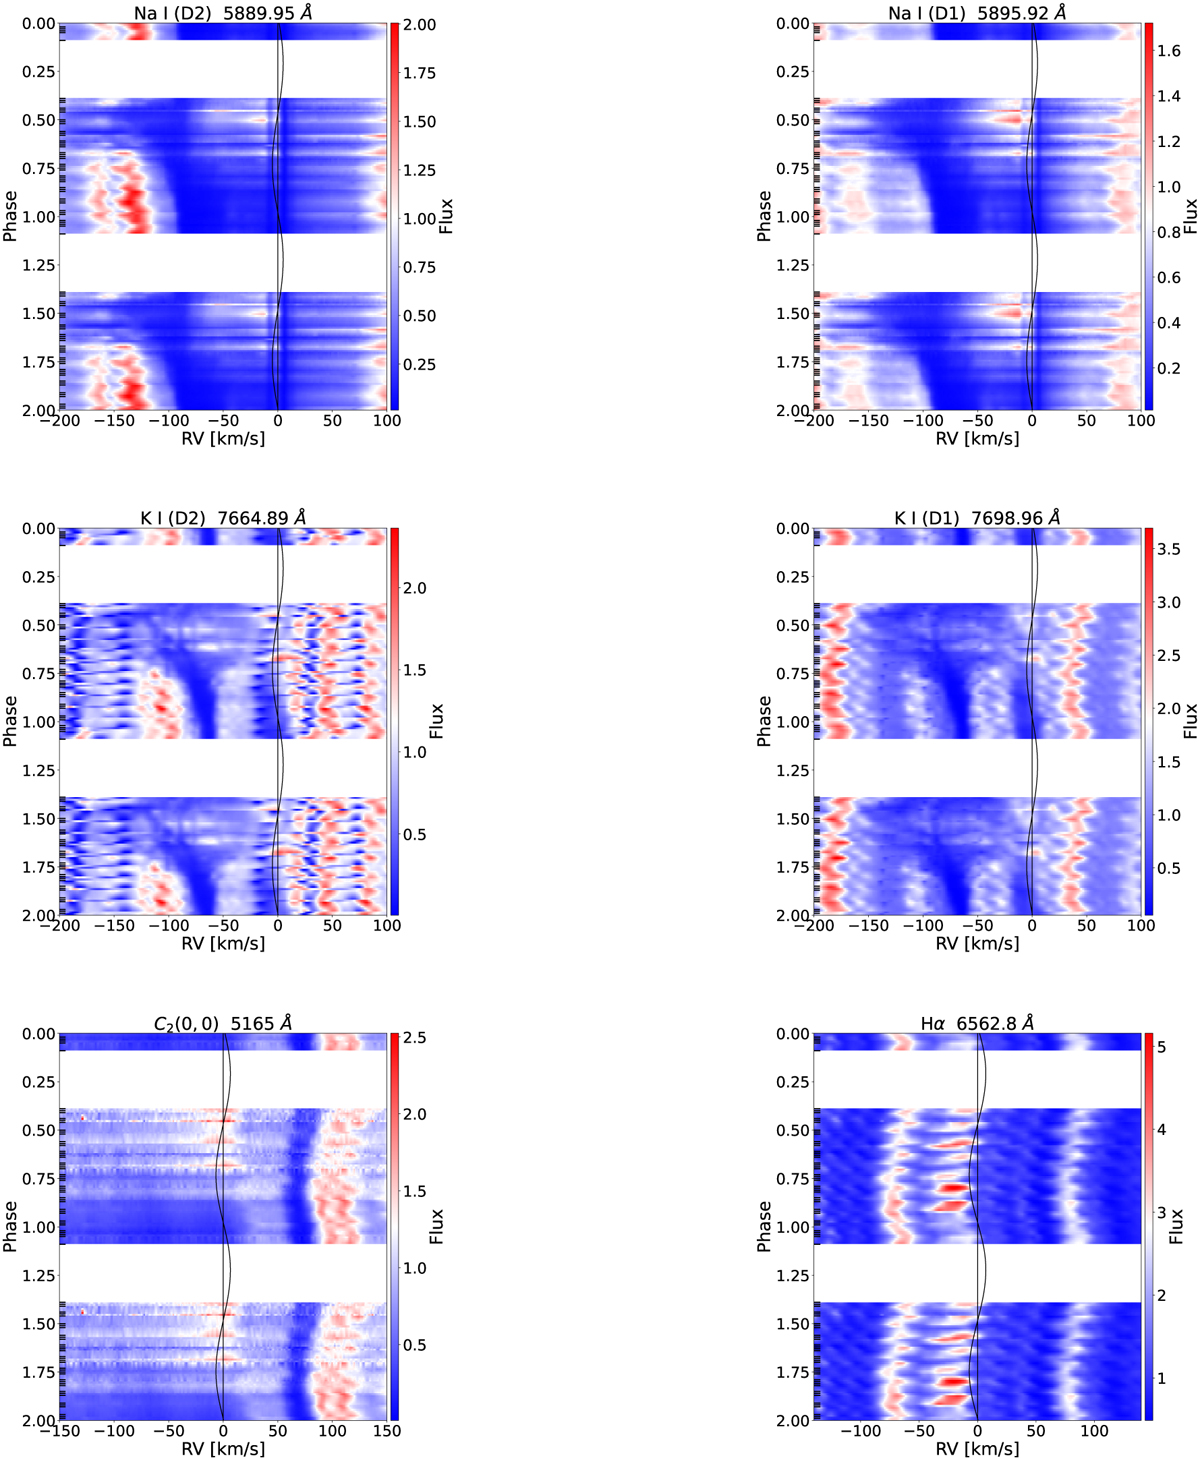
Dynamic spectra of the sodium doublet (top row), potassium doublet (middle row), C2(0,0, bottom left), and Hα (bottom right) of V Hya as a function of the orbital phase. In each panel, the observed phases are shown twice to guide the eyes, time runs down. The colour represents the pseudo-continuum-normalised fluxes taken as the median value of the spectral window. The black curve represents the primary motion while the vertical line marks the systemic velocity, and the horizontal lines on the left indicate the observed phases.
Current usage metrics show cumulative count of Article Views (full-text article views including HTML views, PDF and ePub downloads, according to the available data) and Abstracts Views on Vision4Press platform.
Data correspond to usage on the plateform after 2015. The current usage metrics is available 48-96 hours after online publication and is updated daily on week days.
Initial download of the metrics may take a while.