Fig. 5
Download original image
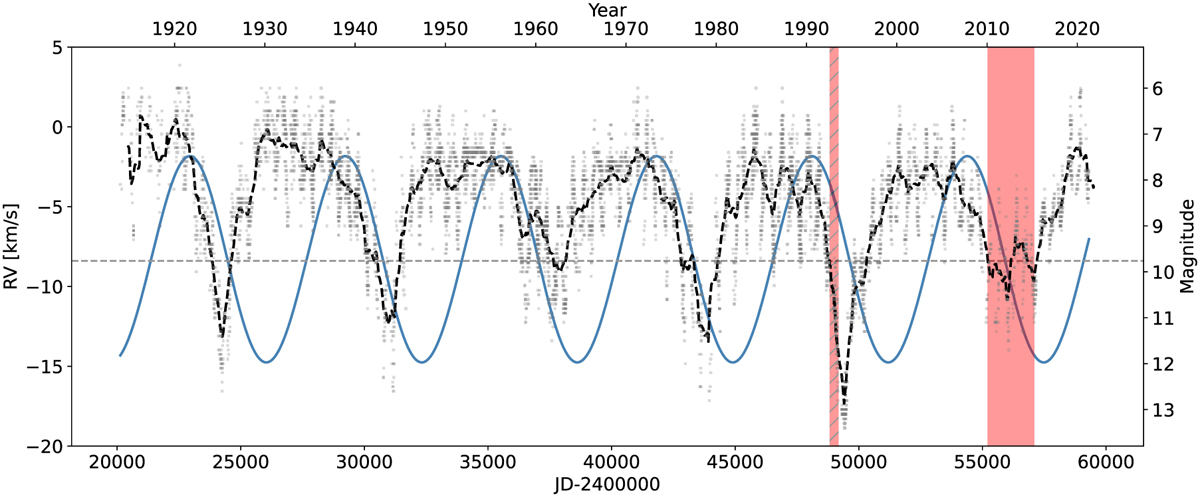
AAVSO lightcurve of V Hya recorded since 1913, displaying six evenly spaced dimming events. The blue curve is the extrapolated spectroscopic orbit. The red regions are the observing epochs of sodium absorption (see Sect. 5.1) from the HERMES monitoring (filled rectangle), and from the observing dates of Lloyd Evans & Carter (1993, dashed rectangle).
Current usage metrics show cumulative count of Article Views (full-text article views including HTML views, PDF and ePub downloads, according to the available data) and Abstracts Views on Vision4Press platform.
Data correspond to usage on the plateform after 2015. The current usage metrics is available 48-96 hours after online publication and is updated daily on week days.
Initial download of the metrics may take a while.