Open Access
Fig. 4
Download original image
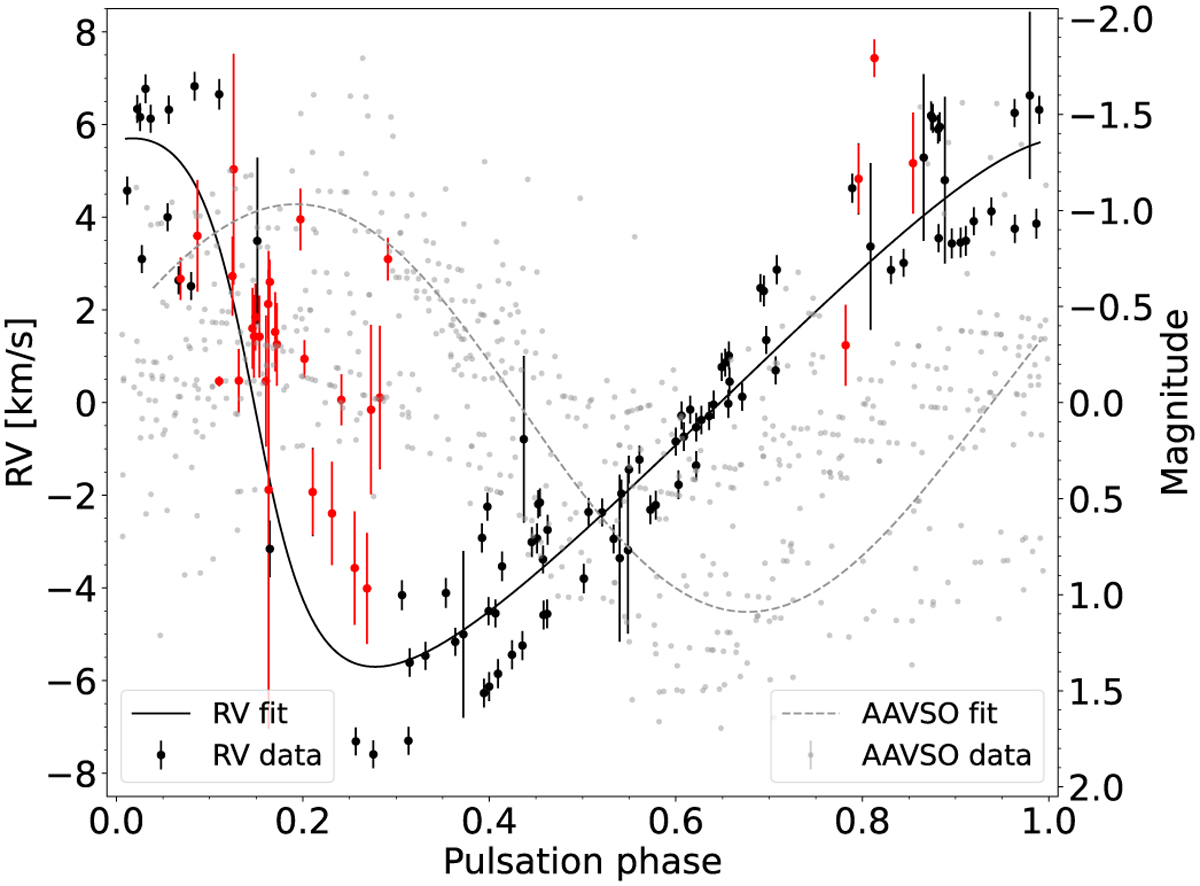
RV curve cleaned from the Keplerian motion, the AAVSO light curve with the 530 days rolling-mean signal removed, and their best-fitting functions phase-folded with respect to the pulsation period. The red dots correspond to the RV data affected by shocks and not used in the analysis (see Sect. 2).
Current usage metrics show cumulative count of Article Views (full-text article views including HTML views, PDF and ePub downloads, according to the available data) and Abstracts Views on Vision4Press platform.
Data correspond to usage on the plateform after 2015. The current usage metrics is available 48-96 hours after online publication and is updated daily on week days.
Initial download of the metrics may take a while.