Fig. E.4
Download original image
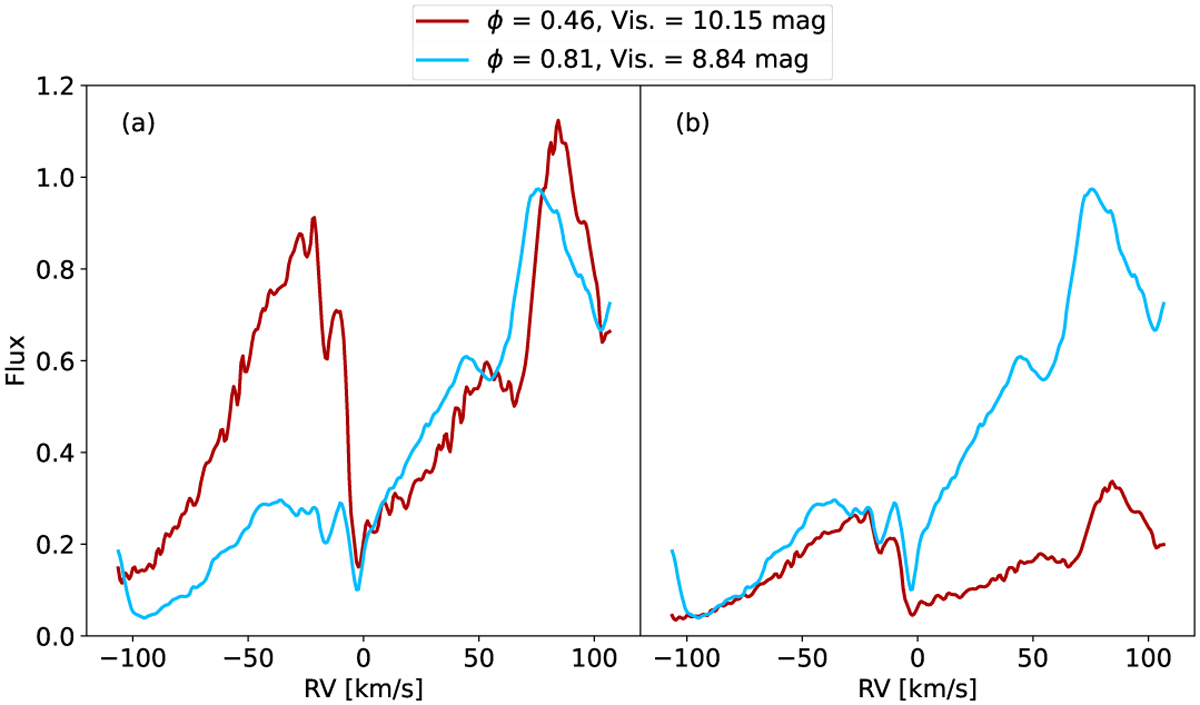
Normalisation effect on the Na I D1 line profile for spectra taken at two different phases, (a) The normalisation is obtained by dividing each spectrum by its mean over a 100 Å window. This procedure is incorrect (see text), (b) The normalisation between the two spectra takes into account the relative flux ratio of 0.33 between the two phases corresponding to a drop of 1.31 mag. The RV zero point is set to λ = 5895.92 Å.
Current usage metrics show cumulative count of Article Views (full-text article views including HTML views, PDF and ePub downloads, according to the available data) and Abstracts Views on Vision4Press platform.
Data correspond to usage on the plateform after 2015. The current usage metrics is available 48-96 hours after online publication and is updated daily on week days.
Initial download of the metrics may take a while.